

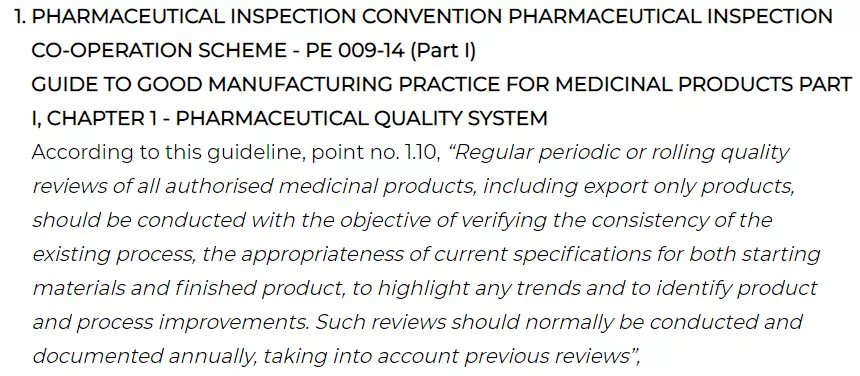
Annual Product Quality Review (APQR)
A complete guide on view of different regulatory bodies and comparison
Annual Product Quality Review (APQR) is a review report required by regulations from different healthcare regulatory authorities. When following the process, the medicine manufacturer required to periodically review that the finished products are consistently meeting the implemented quality standards for the product under review. APQR is also called as Annual Product Review (APR) or Product Quality Review (PQR).
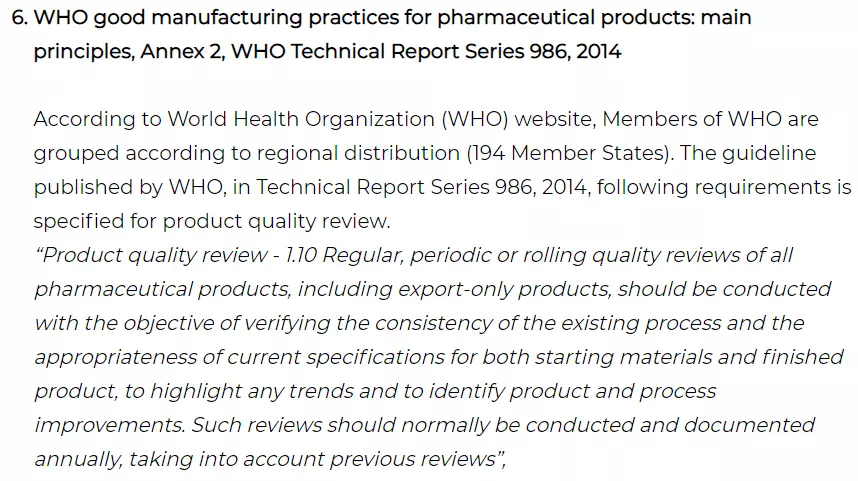
According to the regulation, the drug product manufacturers should review the manufacturing process and quality parameters minimum annually. The review will help to determine the need for changes in drug product specifications or manufacturing or control procedures. Furthermore, the objective of the APQR or regular periodic assessment is to verify the reproducibility of the process, the suitability of current specifications of materials and finished product, highlight any trends, and identify product and process improvements.
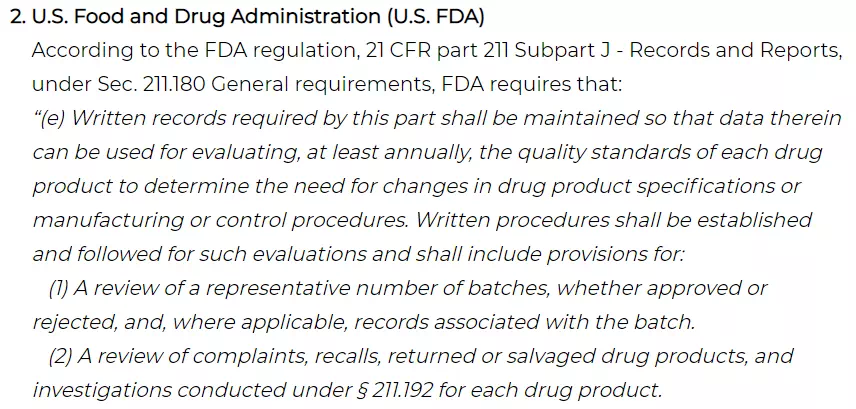
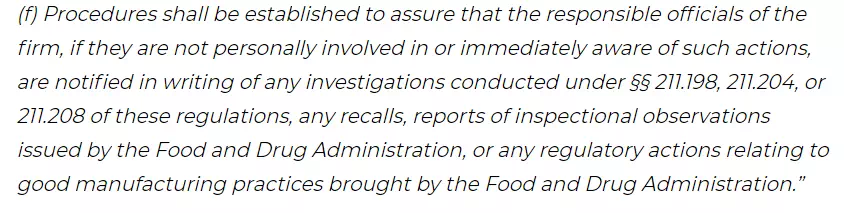
You can see these requirements in most of the regulatory guidance and regulations. I tried to cover a few of the guidance in this article to provide an overview and the importance of the requirement. You will find many differences in different guidelines. We will see those differences in the requirements for the United States, European Union requirements, guidance published by ICH (The International Council for Harmonisation) and PICS (Pharmaceutical Inspection Convention Pharmaceutical Inspection Co-operation Scheme).
A. Guidelines applicable for APQR
Following are the requirements for Annual Product Quality Review specified in various guidelines and regulations.


B. Comparison between different guidelines for APQR
More or less, the objective to carry out an annual product quality review is to verify the product behavior over the period, consistency of the process, appropriateness specifications of starting materials and finished product, and to understand the trends to identify an opportunity for product and process improvements. The following table will provide you the guideline to prepare the Annual Product Quality Review SOP (Standard Operating Procedure). The procedure is typically part of Quality Assurance department SOPs.
| Requirements for Annual Product Quality Review | PIC/S | 21 CFR 211 211.180 (e) | ICH Q7 | EU | WHO |
| Objective of APQR | |||||
|---|---|---|---|---|---|
| Appropriateness of specifications for finished product | Y | Y | N | Y | Y |
| Appropriateness of specifications for starting materials including packaging materials | Y | N | N | Y | Y |
| Determine the need for changes in manufacturing and control procedures | N | Y | N | N | N |
| Out of trend and to required process or product improvements | Y | N | N | Y | Y |
| Consistency of the existing process | Y | N | Y | Y | Y |
| Evaluation of data and an assessment for requirement of CAPA | Y | N | Y | Y | Y |
| Frequency, mandates and flexibilities | |||||
| Annually | Y | Y | Y | Y | Y |
| Rolling | Y | N | Y | Y | Y |
| Product grouping e.g., Oral solid, liquid, or sterile | Y | N | Y | Y | Y |
| Taking into account previous reviews | Y | N | N | Y | Y |
| Even if no manufacturing has occurred in the review period, the quality review should be conducted per section ICH Q7, paragraph 2.50, and include stability, returns, complaints, and recalls. (Q and A published by FDA April 2018) | N | N | Y | N | N |
| Review requirements for APQR | |||||
| Review of all representative batches (including approved and rejected) | N | Y | N | N | N |
| RM (starting) and PM (packing) review | Y | N | N | Y | Y |
| Review of new sources | Y | N | N | Y | Y |
| Review of supply chain traceability of active substances | Y | N | N | N | Y |
| Critical IPCs and FG results | Y | Y | Y | Y | Y |
| OOS batches and investigation | Y | Y | Y | Y | Y |
| Deviations or NCs with investigation | Y | Y | Y | Y | Y |
| Effectiveness of CAPA taken for an investigation. | Y | N | N | Y | Y |
| Process and method changes | Y | N | Y | Y | Y |
| MA variations submitted, granted or refused | Y | N | N | Y | Y |
| A review of results of the stability monitoring program | Y | N | Y | Y | Y |
| Stability studies and trend | Y | N | N | Y | Y |
| Complaints, recalls and return and its investigation | Y | Y | Y | Y | Y |
| Review of salvaged drug products | N | Y | N | N | N |
| Appropriateness of previous product process or equipment CAPA | Y | N | N | Y | Y |
| For new MA and variations to MAs/ dossiers, a review of post-marketing commitments | Y | N | N | Y | Y |
| Equipment and utilities qualifications-Water-HVAC-Compressed Air | Y | N | N | Y | Y |
| Contractual or technical agreements | Y | N | N | Y | Y |
| Responsibilities and post review requirements | |||||
| Follow-up actions and verification during internal audits | Y | N | N | Y | Y |
| Timely completion of CAPA | Y | N | Y | Y | Y |
| Responsibility of quality review. | Y | N | N | Y | Y |
| Responsibility of QP/ Quality person for timely completion and ensure correctness | Y | N | N | Y | Y |
C. Documentation for the APQR
In this section, I am providing an outline and general idea for the preparation of APQR. A reader can use this section to develop an APQR template.
- Batch manufacturing details:
In this section of the APQR, provide details regarding the batches manufactured between periods under review. The details shall contain information about batch Size and status of the batches. The details can be organized under the heading, number of batches manufactured, released, rejected, under manufacturing process, the total number of batches, batches shipped into the market.
- Review of starting materials including packaging materials:
Guidelines recommend giving more emphasis on the review of new vendors introduced during the review period. The review also covers the quality parameters of key raw materials. The details can be organized by collecting the data such as material code, name of the material, unique batch number, name of the approved supplier or manufacturer. The review also should cover a number of rejections in the year. The quality index for each material can be calculated by factoring the number of rejects per year per vendor out of total supplies during the review period.
- Review of API supply chain traceability:
In this section of the document, the supply chain traceability of the API should be reviewed. This will include quality agreement arrangements, product supply chain routes assessment, transportation condition, and distributor involved if any. If the distributor is involved and intermittent storage is happening, the distributor should also be part of supply chain traceability.
- Review of qualification status of equipment and utilities:
In this section, a review shall be carried out for the utility and equipment qualification status. Data can be tabulated for equipment name, equipment number, last qualification date, next due date. In the case of utility systems where continuous monitoring is in place, trend data can be reviewed, such as environmental monitoring, water system trend monitoring. The review can also be expanded for review of major changes, breakdowns, and maintenance.
- Review of product process validation and changes:
Provide information regarding Provide information regarding the introduction of a new commercial product, change in the manufacturing process, change in equipment, and change in the manufacturing area or location. Also, discuss corresponding process validation carried out or quality comparison done. The details that should be included in this section can be change control number, batch numbers that were validated as an outcome of change, and the outcome of the validation exercise.
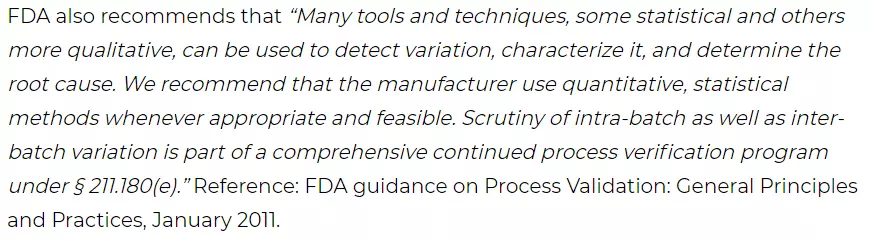
Data regarding critical process parameters and critical quality attributed should be considered for review. Appropriate statistical evaluation should be considered for the evaluation of compiled data.
- Review of critical in process parameters:
In this section, the Critical Process Parameter (CPP) shall be compiled from the batch manufacturing records. Examples of CPPs for tablet and capsule manufacturing would be, granulation, dry mixing, wet mixing, drying, blending, compression, capsule filling, and coating. Examples of injectable products are solution preparation parameters such as mixing time, preparation time, filtration time, sterilization time, sterilization parameters, filling machine speed, rejects, etc.
These data should be evaluated statistically to understand the robustness of the process. Process capability index is the best tool, which can be used to understand process control.
As an outcome of the evaluation, control limits or trend limits can be calculated. The batches which will be manufactured in a subsequent year should be monitored against the calculated control or trend limits by the manufacturing supervisor to ensure that batch under manufacturing is done under a controlled condition and potential for batch failure because of process deviation could be eliminated.
- Review of in-process controls or analytical records of intermediate stages:
Similar to the CPP, Critical Quality Attributes (CQAs) at each stage of monitoring should be monitored and trended. This will help to understand the robustness of the manufacturing process at each stage of manufacturing. Similar to the CCP discussed in the above section, the trend limit should be calculated and future batches should be monitored against the derived trend limit. The limit shall be reviewed every year for the need for any changes based on historical data.
- Review of analytical records of finished product:
The same approach can be applied to review the CQA at the finished product stage.
- Review of complaints:
Received complaints about the product during the review period should be trended to evaluate the status of the complaint, outcome of an investigation, implementation of CAPA, and CAPA effectiveness. The review should emphasize on verification of any repeat complaint because of CAPA failure.
- Review of recall:
In this section, data should be compiled regarding quality related returns, product recalls and investigations performed. The status of CAPA implementation should be verified to ensure that it is adequately implemented to prevent reoccurrence.
- Review of Change Control:
Details of all changes concerning the process or analytical methods or any other product-related change shall be compiled. Details of change and status of change control closure. Should be documented.
- Review of Deviations, Out Of Specification and Out of Trend:
Details should be compiled regarding significant deviations, Out Of Specification and Out of Trend or NCs, its investigations, and the effectiveness of CAPA. Details of root cause and its category and status of investigation should be reviewed.
- Review of stability program and product retain sample:
Details stability study initiated during the review period as well as a review of the ongoing stability study should be done under this section. The data set should include but not limited to the batch number, packaging profile, reason for stability study, current status, and outcome of study up to the review period.
Review of retains sample should cover outcome of visual checking.
- Review of marketing authorization/ dossier:
This section should cover a review of MA variations, submitted/ granted/refused, including those for third country (export only) dossiers. Post-marketing commitments review for new MAs and variations to MAs should be included under this section.
- Review of technical/ contract agreements:
In this section, technical/ contractual agreements for all the GMP regulated outsourced activities should be review for validity and status. This will include but not limited to contract manufacturing, testing, packaging, labeling validation, etc.
- Review of technical agreement between manufacturer and marketing authorization holder:
In this section, technical agreements between manufacturer and MA holder should be reviewed for validity and status.
- Verification of previous reviews or previous year APQR:
In this section of the document proposed actions during the previous APQR should be verified for the implementation status. This also shall include a review of products which was under manufacturing while approval of previous year APQR.
- A review of all changes carried out to the processes or analytical methods:
This section shall cover a review of revisions made in the documents for manufacturing processes or analytical methods. During this review, the status of all the documents shall be reviewed for their validity.
- Review of media fill (applicable for sterile facility):
During this review, coverage of product under a matrix of media fill shall be verified.
- Review of environmental monitoring:
For sterile manufacturing facility adequacy of the environmental condition is very essential. In this section of the document, environmental monitoring trend should be reviewed for excursions, frequency of excursions and adequacy and effectiveness of implemented CAPA should be reviewed.
- Review action implementation status of regulatory deficiency for the product:
During the APQR, it is also important to verify the CAPA implementation status and effectiveness review status of regulatory deficiency (if any observed).
- Conclusion and recommendations:
Once the review gets completed, a conclusion on the review outcome should be derived. The conclusion should include but not be limited to improvement opportunities for production process and specifications, implementation status of previous year APQR recommendation, CAPA effectiveness review, and process capability. In the conclusion statement, it should be ensured that all the objective of preparation of APQR is been met or not.
- Approvals:
The APQR/ PQR should be reviewed by a cross-functional team of manufacturing, quality control, regulatory affairs, and quality assurance. The review should be done with the intent of identification of improvement opportunities to improve the process capability and constancy.
D. Scheduling of APQR
Annual Product Quality Review is required to be performed for each product with annual frequency. As indicated in the above table, the guidance suggests performing APQR on a rolling or a rotation basis with annual frequency.
An example of rolling APQR can be done in such a manner that total products can be divided into groups such as Group 1 – January to April, Group 2 – May to August, and Group 3 – September to December. As per this example, the APQR of Group 1 product needs to be completed from January to April every year.
While preparing the schedule, the priority can be decided on a risk-based approach. This priority can be decided with help of parameters such as the number of batches marketed, customer complaints, product recall, stability failures, product deviations, out of trends, customer requirement, etc.
E. Importance of statistical evaluation during product quality review
The statistic will help you understand process drifts over the period, exceptions or process outliers, an opportunity for improvements in processes, determining limits for Out of Trend (OOT) for ongoing batches, redefining the in-process controls and specifications, etc.
Statistical calculations such as minima, maxima, averages, relative standard deviation (RSD), process capability index (Cp), minimum process capability index (Cpk), process performance index (Pp), and minimum process performance index (Ppk) shall be applied where appropriate. The statistic should be applied to collected CPPs and CQAs. The data also should be presented in the form of control charts.
- Calculation formula for Cp, Cpk, Pp and Ppk:
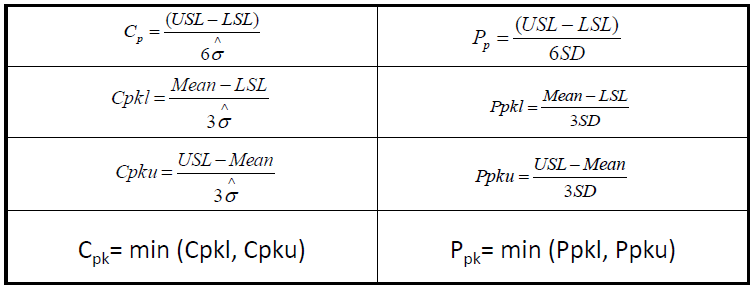
USL: upper specification limit;
LSL: lower specification limit;
Mean: grand average of all the data
Sigma hat: estimated inherent variability (noise) of a stable process
SD: overall variability
Get Free Excel sheet for calculation of Process Capability Indices – Cp, Cpk, Pp, and Ppk.
Click to this link to know more about Process Capability Indices – Cp, Cpk, Pp, and Ppk
Difference between Cpk and Ppk:
Cpk represents the potential process capability (i.e. how well a given process could perform when all special causes have been eliminated).
Ppk addresses how the process has performed without the demonstration of the process to be stable.
If Cpk is approximately equal to Ppk, the process is in statistical control
If Cpk is significantly different than Ppk, the process is not in statistical control
The reality is that Cpk is a better estimate of the potential of your process. It represents the best your process can do and that is when the within subgroup variation is essentially the same as the between subgroup variation.
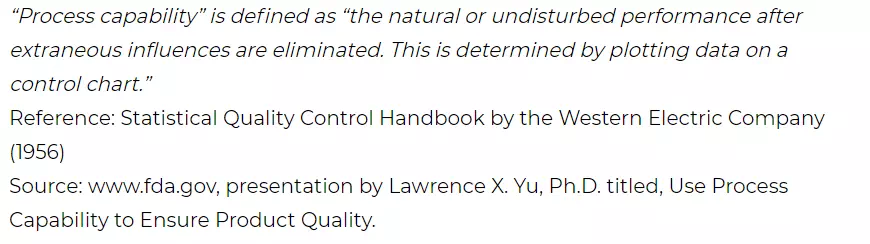
Reference: www.spcfor excel.com, www.fda.gov, presentation by Lawrence X. Yu, Ph.D. titled, Use Process Capability to Ensure Product Quality.
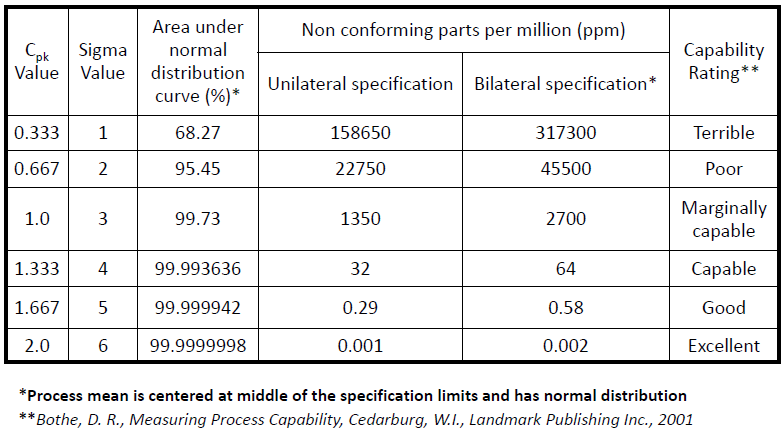
- Interpretation of Cpk index
Process capability index will help to understand the behavior of the process and gives an idea about capability rating.
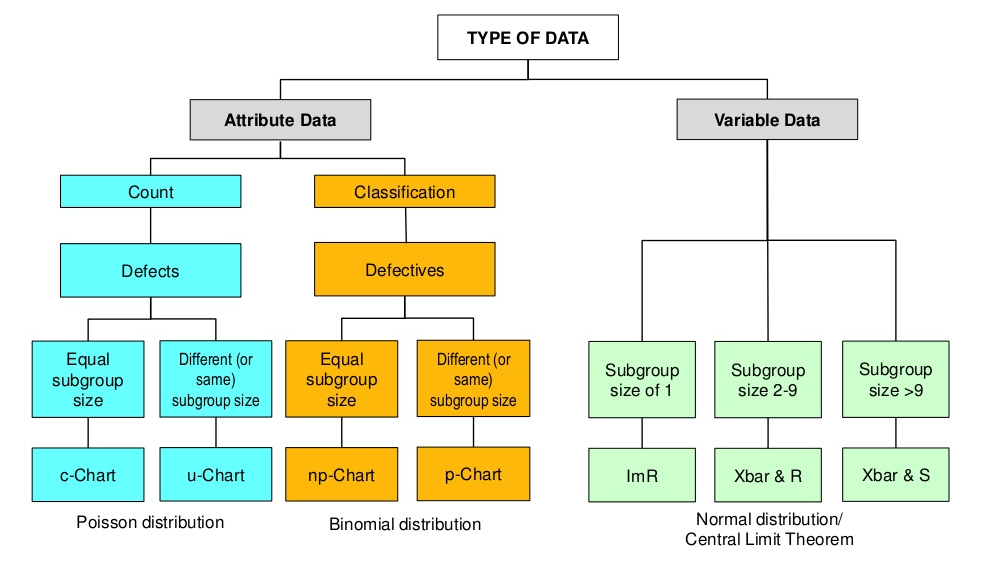
- Types of control charts
Depending on the types of data, there are two types of control charts.
Variable control chart: continuous numeric measurements (e.g. assay, dissolution, uniformity, impurity level)
Attribute control chart: discrete data (pass or fail, or counts of defects)
Control charts can be used to determine whether the process is in a state of control or out of control (unpredictable versus consistent).
There are eight rules to interpret the control charts. These rules are also called Nelson rules. These rules were published in the October 1984 issue of the Journal of Quality Technology in an article by Lloyd S Nelson. Interpretation of out of control for non-random situations can be done as follows.
R-U-L-E – 1:
Any one point is > 3 SD from the average (Beyond Zone A). This means the point is Out of Trend (OOT)
R-U-L-E – 2:
9 (or >) points consecutively are on the same side of the average. Some continued bias happens. (In or beyond Zone C). This means the average is probably changed.
R-U-L-E – 3:
6 (or >) points consecutively are progressively increasing or decreasing. A trend exists. This test indicates a drift in the process average. Such drift could be resulted because of wear and tear, maintenance issues, improvement in skill, etc.
R-U-L-E – 4:
14 (or >) points consecutively alternating up and down, increasing then decreasing. This pattern specifies that 2 systematically alternating causes are producing different results. This could happen while using two alternate suppliers, monitoring quality for two different or alternating shifts. The fluctuation is beyond the noise.
R-U-L-E – 5:
2 (or 3) out of 3 points consecutively are > 2 SD from the average in the same direction (In Zone A or beyond). This is the signs early warning of process shift.
R-U-L-E – 6:
4 (or 5) out of 5 points consecutively are > 1 SD from the average in the same direction (Zone B or beyond). Similar to the above point, this is an early warning indicator for potential process shift. There is a strong propensity for samples to be slightly out of control.
R-U-L-E – 7:
15 points consecutively are all within 1 SD of the average on either side of the mean (within Zone C). This indicates a smaller variation than expected.
R-U-L-E – 8:
8 points consecutively exist, but none within 1 SD of the avearge, and the points are in both directions from the avearge (Within Zone B or A or beyond). This specifies that different samples are affected by different factors. This could happen if different samples in a chart were produced by 1 of 2 different machines, where one produces above average and the other below.
By applying the above rules, one can identify an “out of trend” situation. There may be a possibility for false alerts. However, adopting the approach to identify OOT, investigate and rule out rather than completely ignoring the things. Investigating OOT will help to prevent potential failures.
Reference from: https://www.leansixsigmadefinition.com/
F. Retention period of APQR
By general rule, any document related to batch should be stored for product expiry + 1 year or five years, whichever is longer. However, sometimes APQR and continuous process verification are merged and documented as one record. Continued Process Verification is a requirement as per current FDA guidance on Process Validation: General Principles and Practices, January 2011. In this guideline, the requirement of 21 CFR 211.180(e) is linked with the Continued Process Verification (Stage 3 – of process validation). Process validation documents are generally stored for the lifecycle of the product. It is always prudent to store the APQR record for product lifecycle because, individual batch record retention time is product expiry + 1 year or five years, whichever is longer. APQR will serve as a database for the product and can act as a tool for investigation, process improvement, and product history.
G. Conclusion
APQR conclusion should consist of these three elements (i) Assessment and conclusion, (ii) Comments and recommendations, and (iii) Corrective Action and Preventive Action (CAPA).
APQR is an indicator of a product’s health at a given point in time. Assessment and conclusion can be derived based on the evaluation process in control. A review of data and statistical evaluation would indicate that process is in a state of control and producing consistent quality of product and confirms that the process continues to function as validation or it is opposite. If the review indicates that the process is not in the state of control, improvement opportunity needs to be evaluated.
Comments and recommendations can be made based on the above assessment. The recommendation can be applicable in both cases, i.e. process found robust or the process is not producing a consistent quality of the product. If the process is robust, specification limits can be tightened further to ensure that future products will be produced with tightened process parameters and any outlier identified can be investigated. On the other hand, if the process needs improvement, an appropriate recommendation can be made to improve the product performance.
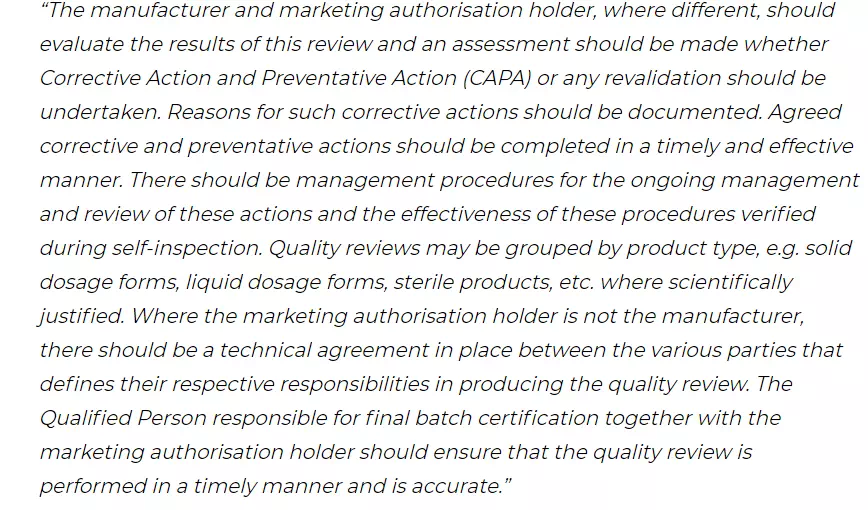
Corrective Action and Preventive Action (CAPA) should be documented and tracked in case of any recommendation is made. Reasons for CAPA should be documented. Corrective and Preventive action should be completed in a timely and effective manner.
