
Statistical Tools and its Application

Histogram

What is Histogram?
A tool that represents the data in terms of frequency and its distribution
When to use it?
When you want to visualize data distribution in the form of a curve
This is indicative parameter while decision making
What you will get?
Data distribution across the range, middle location of data, minimum and maximum value of data, and shape of the data.
What types of data require to plot the chart?
Continuous Data
Limitation
Only one data set can be studied using one histogram.
Pareto Chart

What is Pareto Chart?
Pareto Chart is a tool to compare different attributes based on their frequency of appearance. The chart will yield area to prioritize and vital few to focus upon.
When to use it?
When you want to prioritize focus area based on the category. The data is very helpful in decision making in terms of prioritization of focus area.
What you will get?
Cumulative data to understand vital few.
What types of data require plotting the chart?
Frequency or count.
Caution while using it
Grouping of data is critical for true representation and decision making.
Box Plot
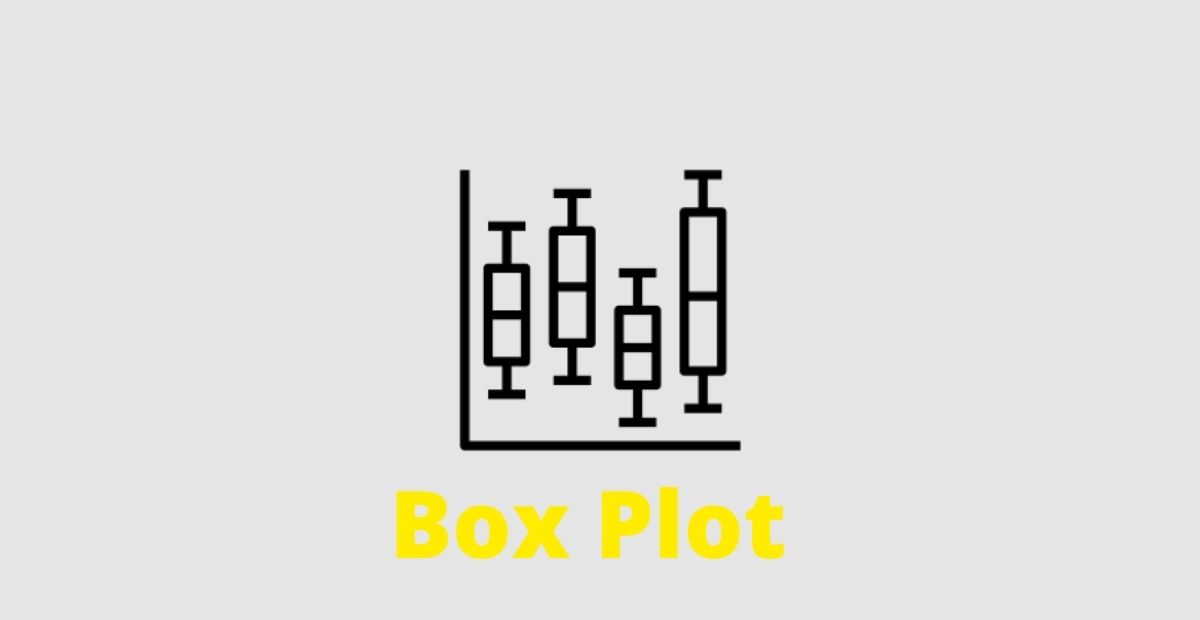
What is Box Plot?
Box Plot is a tool to define data distribution and compare the location and spread of multiple data sets of one parameter.
When to use it?
This plot is used to verify the data distribution and compare. This will help to points out median and outliers in data. This will help to compare the distribution of more than one data set.
What you will get?
Data concentration, spread of data, Skewness, and Outliers. This plot can compare multiple data sets in a single graph with multiple box plots.
This tool will provide indicative data and support for decision making. Median Line, Height of box and length of Whisker will help in decision making based on the data.
What types of data require plotting the chart?
One parameter of multiple data sets.
Caution
This is for indicative or comparative decisions making. Not an absolute decision making tool such as Pareto or Regression analysis.
Time Series Plot

What is Time Series plot?
Time Series plot is a tool to visualize process behaviors over a time period or when there is a change in the process behavior over the period of time. This plot shows trends and patterns of the data.
When to use it?
When you want to understand the change in the behavior of the data with respect to time or sequence.
What you will get?
Once can see the data behavior over the period of time, out of trend, drift in the data, typographical errors, and visual validation of data. This is indicative information and can be used to plan hypothesis studies.
What types of data require plotting the chart?
Data to be collected at consistent interval and type of samples should be systematic sampling.
Caution
Process Subject Matter Expert and design of experiment data require interpreting the graph.
Control Chart
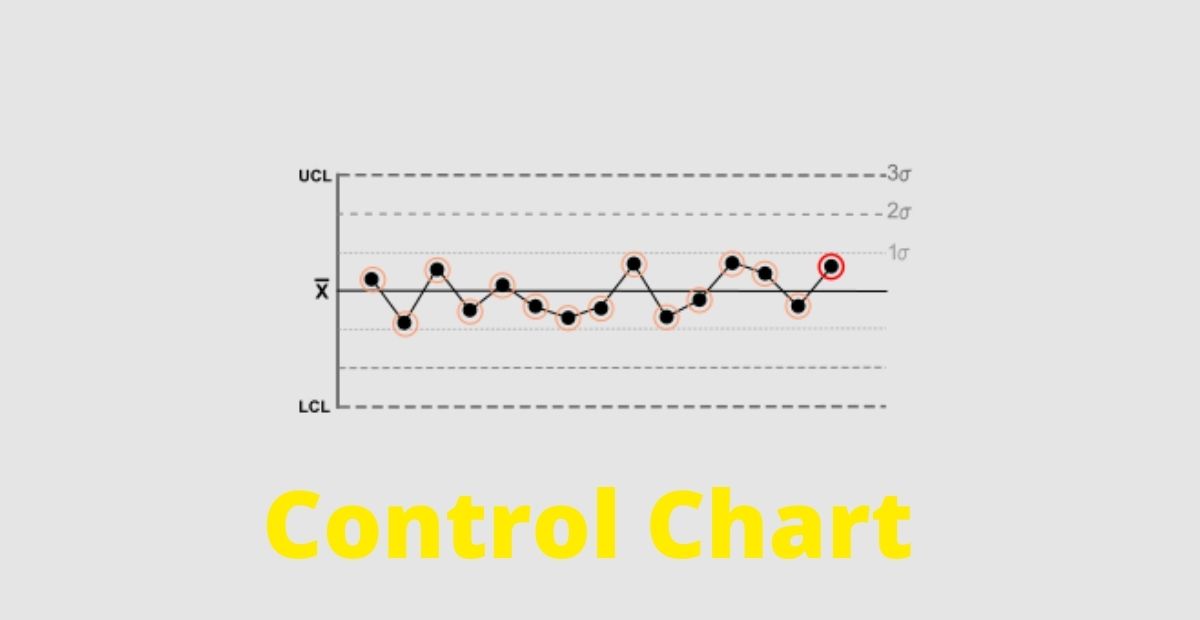
What is Control Chart?
A Control Chart is tool to check the statistical stability of the process. This will help process needs adjustments or improvements Statistical Stability.
When to use it?
Control chart is used to see whether the process is under statistical control or under statistical stability
What you will get?
Common cause of variation and special cause variation can be understood using control charts. Te data are used for decision making or proactively act to control process within the trend.
What types of data require plotting the chart?
Data to plot the chart are collected with the method of systematic sampling. Data to be collected with constant interval.
Caution
Higher stability does not indicates higher capability
Normality curve

What is Normality curve test?
The normality curve tool is used to check whether the data is following a normal distribution, which is bell-shaped curve or skewed one
When to use it?
When you one wants to know whether the distribution of data is normal or unpredictable
What you will get?
This will give clear indication for decision making. When p-value is more than 0.05, the data is said to be close enough to Normal data.
What types of data require plotting the chart?
Histogram
Process Capability (Cp)
What is Process Capability (Cp)?
A tool to measure the ability of process to meet customer requirement based on the data compiled for short term.
When to use it?
To measure the capability of process to verify that the process is meeting to the customer specifications or not.
What you will get?
Based on the Cp Value, it can be decided that how less is the process variation in comparison with the allowed variation.
What types of data require?
Constant interval data
Caution
This tool can only be used for established process; not for a new process.
Process Capability (Cpk)

What is Process Capability (Cpk)?
A tool to measure the ability of our process to meet customer requirement with respect to the studied parameter in short term.
When to use it?
To measure the capability of process to verify that the process is meeting to the customer specifications or not.
What you will get?
Based on the Cpk Value, it can be decided that how much close is the mean to the target and how much less the process variations compared to allowed variations.
What types of data require?
Constant interval data.
Caution
This tool can only be used for established process; not for a new process. While calculation, use short term Standard Deviation.
Defects per million opportunities (DPMO )
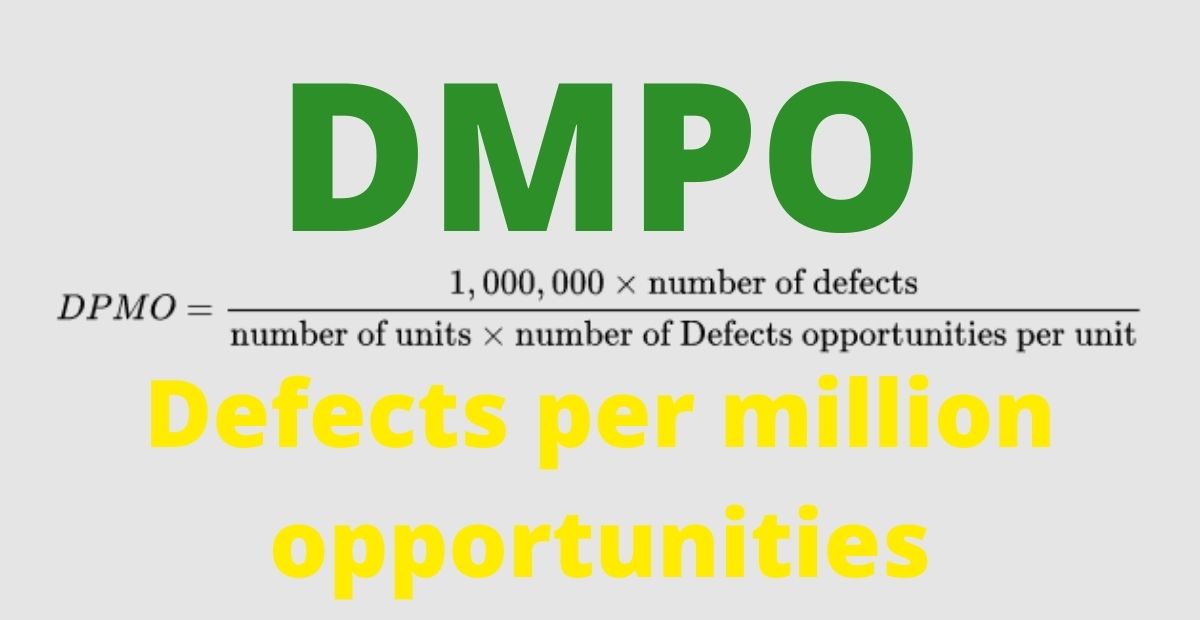
What is Defects per million opportunities (DPMO)?
This tool is used to measure the number of defects the process will produce during the process.
When to use it?
To assess our process capability in terms of number of defects produced by the process.
What you will get?
This is also a capability indicative value. It is used to assess process capability in terms of number of defects produced by the process.
What types of data require?
Number of defects produced in a process and not the number of defective pieces.
Caution:
It is different from Parts Per Million (PPM).
Brainstorming
What is Brainstorming?
Brainstorming is a tool to collect ideas and opinions from subject matter experts on a specific subject by forming small team.
When to use it?
To identify all possible causes, solutions or probable cause of any event or incident.
What you will get?
Most probable cause of failure or most probable solutions that are jointly agreed upon and exhaustive list of it.
What is prerequisite?
Subject Matter Expert from different functions departments who have basic knowledge about the process.
Caution
Every ideas counts. List of probable causes and potential solution is exhaustive.
Fishbone Diagram

What is Fishbone Diagram?
Fishbone Diagram is a tool to collect ideas for the probable causes into six categories. This tool is used in combination with brainstorming.
When to use it?
To identify all possible causes, or probable cause of any event or incident or try to identify what could have gone wrong in the process.
What you will get?
Most probable cause of failure or most probable solutions that covered all the 6 categories (6M: Method, Material, Machine, Mother Nature, Measurement, and Man). There is a high probability that we have covered all the possible causes.
What is prerequisite?
Subject Matter Expert from different functions departments who have basic knowledge about the process.
Caution
‘Man’ has to be considered as last category not the first.
Why-Why Analysis or 5-Why Analysis

What is Why-Why Analysis or 5-Why Analysis?
Why-Why Analysis or 5-Why Analysis is a tool to dig down into the root cause by asking multiple whys.
When to use it?
To identify root cause of all primary causes.
What you will get?
This tool will provide list of most probable causes that can be action upon to eliminate the cause of incident or event.
What is prerequisite?
Participation of SMEs in brainstorming those have basic knowledge about the process and the problem.
Caution
Knowing where to stop, it is suggested to stop at actionable “Why”.
Regression Analysis
What is Regression Analysis?
Regression Analysis is a tool to verify the relationship between two process variables.
When to use it?
When one wants to mathematically determine the relationship between two process variables.
What you will get?
By using the regression analysis, R-Square Value can be calculated. This mathematical equation states the relationship between the variables under scope. This will provide indication that one variable is impacting the other variable or not and what would be the intensity of the impact.
What is prerequisite?
Data of two or more variables collected for same sample or at same time.
Caution
Careful analysis of data.
Hypothesis Testing
What is Hypothesis Testing?
Hypothesis Testing is a tool to test the results of a survey or experiment to see that the theory established based on investigation can be proved with the evidence and data and if it gives meaningful results.
When to use it?
When you want to statistically validate the anticipated theory with the help of experiment.
What you will get?
Hypothesis result will validate or disregard the assumption made for the data or process based on the outcome of hypothesis testing.
What is prerequisite?
Statement of assumptions.
Caution
The assumption might be wrong.