
Deviation or non-conformance management and Quality Risk Management
Application in Pharmaceutical and health care industry
Deviation management or non-conformance management system plays a very vital role in the pharmaceutical and biopharmaceutical quality system.
Process for deviation management remains the same irrespective of industry and organizations. However, customization may require depending on an individual organization’s need, regulatory requirements, and types of business models.
It is very important to document and investigate deviation to the written procedure, or unexpected discrepancy noted during GMP operations. The deviation process helps identify potential risk to product quality and patient safety and identify the root cause of the event. Upon identification of root cause, appropriate corrective action and preventive action can be implemented to prevent reoccurrence.
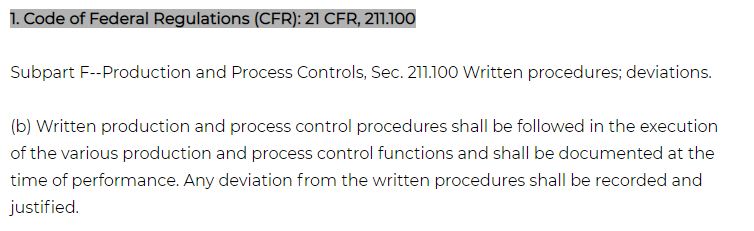
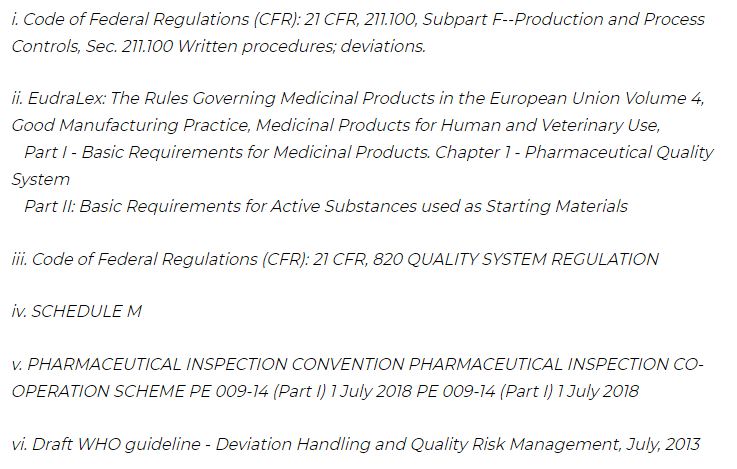
Regulations references and guidelines
Definition of deviation
The deviation is an occurrence of an unexpected event, a departure from procedures or specifications in the GMP environment.
The occurrence may or may not have potential risk to the identity, strength, quality, purity, safety, efficacy, performance, reliability, or durability of the drug substance/ drug product. However, any departure from the procedure must have to be documented and investigated.
The unexpected events which may have a potential impact on the validation status of the process, equipment, utility, facility, software or impact on regulatory filings should also be handled through the deviation management process.

Example of deviations
- Departure from the approved specifications or procedure
- Failure to meet in-process control (IPC) specifications of drug products
- Failure to meet the requirement of approved dossier or filing (ANDA, NDA…)
- Equipment, instruments, or systems breakdown during batch production
- Loss of data or documents
- Malfunctioning of computerized system where the product or GMP relevant data are lost
- Unauthorized changes in the facility, document, software, or utility without a change management system
- Non-compliance to regulatory requirements
- Failure in utility system resulting in environmental excursions in the facility
Classification of deviation or quality events
The criticality classification of deviations in a traditional way was qualitative and simply based on definitions and given examples in the procedure. However, authorities and guidance encourage organizations to classify the events based on quality risk management (QRM) tools. The classification and scope of the investigation should be based on the identified criticality level.
Critical Deviation: When the deviation affects quality attribute, critical process parameter, equipment, or instrument critical for process control, and may have an impact to patients (or personnel or environment). Such deviation is categorized as Critical.
For example;
- Cross-contamination or product mix-up
- Sterility failure
- Expired material or component used for manufacturing
- Sterilization record of product-contact material used in an aseptic filling process not available or unacceptable
- Product with wrong expiry date supplied in the market
Major Deviation: When the deviation affects a quality attribute, critical process parameter, equipment or instrument critical for process, control, and the impact to patients (or personnel or environment) is unlikely. Such deviation is categorized as Major.
For example;
- Equipment breakdown during batch manufacturing
- Water system breakdown
- Missing frequency of periodic sanitization
Minor Deviation: When the deviation (departure from the approved procedure) does not affect any quality attribute, critical process parameter, or equipment or instrument critical for process control, it can be categorized as Minor.
For example;
- Missing a periodic revision of SOP
- Miss to take a backup of the computerized system as per the frequency
Risk-based classification
Classification of deviation or event should be done using Quality Risk Management (QRM) principle. A risk assessment or risk rating is a combination of quantitative and qualitative estimation. A quality Risk Management tool, such as Failure Mode Effect Analysis (FMEA), can categorize the deviation. FMEA model of risk assessment calculates a risk rating using these three factors – Severity (S), Probability/ Likelihood (L) of Occurrence rating, and Detection (D). The risk rating is derived by multiplying Severity (S), Probability/ Likelihood (L) of Occurrence rating, and Detection (D). It is called a Risk Prioritization Number or RPN.
Severity (S): Severity is a measure of failure effect. It can be determined by asking a question, “How the event does affects a function?” For example, a problem that may cause a serious risk to the function or safety of a product may be assigned a high priority and require immediate remedial action. On the other hand, an event of missing periodic revision of a procedure may have a lower severity. The severity is a measure of the possible consequences of an event.
The severity can be rated on the scale of 2 to 54 as follows:
Table 1: Severity rating
| Severity | S (*) | Description |
| Low | 2 | Minor GMP non-compliance; no possible impact on patient, yield, or on production capability. |
| Moderate | 4 | Significant GMP non-compliance; possible impact on the patient; moderate impact on yield or production capability. |
| High | 6 | Major GMP non-compliance; probable impact on the patient; high impact on yield or production capability. |
| Critical | 8 | Serious GMP non-compliance; Probable serious harm or death; critical impact on yield or production capability. |
(*) The scoring should be done by the FMEA team members, which should be carefully selected based on scientific background, product knowledge, and experience.
Probability/ Likelihood (L) of Occurrence: The probability of occurrence can be determined by asking the question “What is the frequency of failure?”
Table 2: Probability/ Likelihood (L) of Occurrence rating
| Probability | P (*) | Description |
| Extremely low | 2 | Highly improbable to occur |
| Low | 4 | Improbable to occur |
| Moderate | 6 | Probable to occur |
| High | 8 | Highly probable to occur |
Detection (D): Detection rating can be identified by asking a question “What controls are currently in place to catch or prevent this failure?”
Table 3: Detection
| Detectability | D (*) | Description |
| High | 2 | Auto control system in place has a high probability of detecting the defect or its effects |
| Moderate | 4 | Control system in place could detect the defect or its effects |
| Low | 6 | Control system in place has a low probability of detecting the defect or its effects |
| Non existent | 8 | There is no control system to detect the defect |
Based on Severity, Probability/ Likelihood and Detection rating, Risk Priority Number (RPN) shall be generated.
Table 4: RPN rating
| Risk classification | Risk Priority Number (RPN) | Actions |
| Critical | >216 | Must be addressed immediately and treated as a critical deviation |
| Major | > 40 and < 216 | Must be addressed in a timely manner as a major deviation |
| Minor | <40 | Must be addressed in a timely manner as a minor deviation |
Deviation classification can be done two times. First – at the time of preliminary evaluation based on the event description. Second – post completion of the investigation, which is based on an understanding of facts and thorough impact and risk evaluation.
Deviation can be further classified based on root causes, i.e., Human error, Equipment/ facility, Process related, Product related/ Material related, Procedure-related, Software related, etc.
Determining scope and level of investigation based on QRM and criticality classification
The risk-based classification of the event is not only helping to determine the criticality but also aid in determining the level and scope of investigation and efforts to be made to investigate an event.
Table 5: General steps to carry out investigation
| Sr. No. | Investigation steps | How and what to do | Minor | Major/ Critical |
| 1 | Description of event | A simple and effective method of defining an event is using questions, five W’s and one H approach (5W1H: who, what, where, when, why, how) | √ | √ |
| 2 | Risk classification/ risk evaluation | To evaluate using RPN number | √ | √ |
| 3 | Correction/ containment | Immediate correction required if any | √ | √ |
| 4 | Investigation and root cause analysis using tools such as why-why, Ishikawa diagram etc.; | Visiting event site, gather supporting investigation related to event, historical event review, why-why analysis/ Ishikawa diagram (fishbone analysis) | √ | √ |
| 5 | Conclusion | Conclusion on root cause or most probable causes | √ | √ |
| 6 | Determining Corrective and Preventive Action (CAPA) | Design appropriate CAPA to prevent reoccurrence | √ (If needed) | √ |
| 7 | Verification of actions | To verify implemented actions | √ | √ |
| 8 | Effectiveness review | To verify how effective the implemented CAPA is | √ (If needed) | √ |
Typical deviation management process flow (Diagram: 1)

Trending of deviations
Trending of deviation is very important to monitor and control the events in the organization. Critical and major deviations, open deviations, etc., are required to be closely monitored and trended. During regulatory inspections, one of the important criteria to measure the health of the quality system is review deviations. Key indicators to be verified are critical and major deviations, product-related deviations, human-related error deviations. The trending will also help to evaluate the repeat deviations with respect to a category, root cause, repeated by the same personnel. Based on the trending, CAPA effectiveness can be measured. Suppose any specific event is reoccurring after the implementation of CAPA. In that case, there is a probability that an initial investigation has not been done in-depth to identify all potential causes for similar occurrences. In such cases, based on the trend evaluation, additional CAPA can be proposed.
How to determine deviation trending frequency?
The frequency for trending can be decided based on an average number of deviation occurrences in the last few years. Following is an example to determine the trending frequency of deviations. Suppose the average number of deviation in a year is 3 to 5, quarterly or six-monthly frequency does not provide any value or adequate insight based on trend data. In such instances, yearly trending would be good enough.
Table: 6 – Determination of frequency of deviation trend
| Average number of deviations in a year based on last three years data | Proposed frequency |
| > 75 | Once in a month (cumulative trending i.e. in each month, previous month data should be included) |
| 75 to 50 | Quarterly (cumulative trending i.e. in each month, previous month data should be included) |
| 49 to 25 | Six monthly (cumulative trending i.e. in each month, previous month data should be included) |
| <25 | Yearly |
Note: The above example is provided to understand how the frequency of trending can be defined. I have not referred any guidance for the above frequencies; however, this is based on my thinking and experience. Organization to organization, the frequency of the trending can be different. The approach can be risk-based and in view of improvement to prevent repetitive occurrences of similar deviations and events with similar root causes.
Following is an example template which can be used for trend analysis.

References