
Dissolution Profile Comparisons (f1 and f2) and different country regulatory expectations for Dissolution Similarity Requirements
Calculate the dissolution Profile Comparison, difference factor (f1) and similarity factor (f2) using FREE Excel sheet or Click here to ONLINE Calculate the dissolution Profile Comparison, difference factor (f1) and similarity factor (f2)
Why is dissolution profile comparisons needed?
Dissolution profile comparison is useful during development of new generic formulations, and to evaluate an impact of post-approval changes on product performance. Collecting multi time point dissolution data is very important to accurately predict the in vitro performance of the drug product when compared to a single point approach.
1. Dissolution profile comparison and verification of similarity between dissolution profiles is useful when a generic Oral Solid drug product is developed and it needs to be compared against the Reference Listed Drug (RLD) or innovator.
2. The comparison also needs to be done when there is a noteworthy modification in the manufacturing process or formula of dosage form.
Dissolution profile comparison is carried out using a similar experimental environment to compare (i) pre-change and post change in the manufacturing process or (ii) change in formula of dosage form.
There are several methods to compare the dissolution profile. Details are summarized in given as follows:
- Visual process of comparison (Graphs)
- Statistical analysis
- t-test
- Analysis-of-variance (ANOVA)
- Model-dependent-methods
- Zero order
- First order
- Hixson Crowell cube root law
- Takeru Higuchi model
- Weibull model
- Korsemeyar and peppas model
- Model-independent-methods
- Ratio Test Procedure
- Pair Wise Procedure/ Difference factor (f1) and Similarity factor (f2)
- Multivariate Confidence Regi0n Procedure
- Index of Rescigno
In this article, we shall discuss Model-Independent Methodology Using a Similarity-Factor in and formula of calculation.
Model-Independent-Approach Using a Similarity-Factor
Model-independent mathematical approach was proposed by Moore and Flanner to calculate f1 and f2 to check the similarity between dissolution profiles of different lots.
The model-independent similarity factor (f2) approach is a comparably simple and mostly accepted approach for comparing dissolution profiles. Most of the regulatory agencies demand the f2 as an aid to compare the bioavailability of generic drugs compared to reference listed drugs or innovators.
This is highly appropriate for dissolution profile assessment for comparison when there are ≥ 3 (greater than or equal to 3) dissolution time points’ comparison need to be done.
This method is applicable for Immediate Release (IR) as well as Modified Release (MR) formulations.
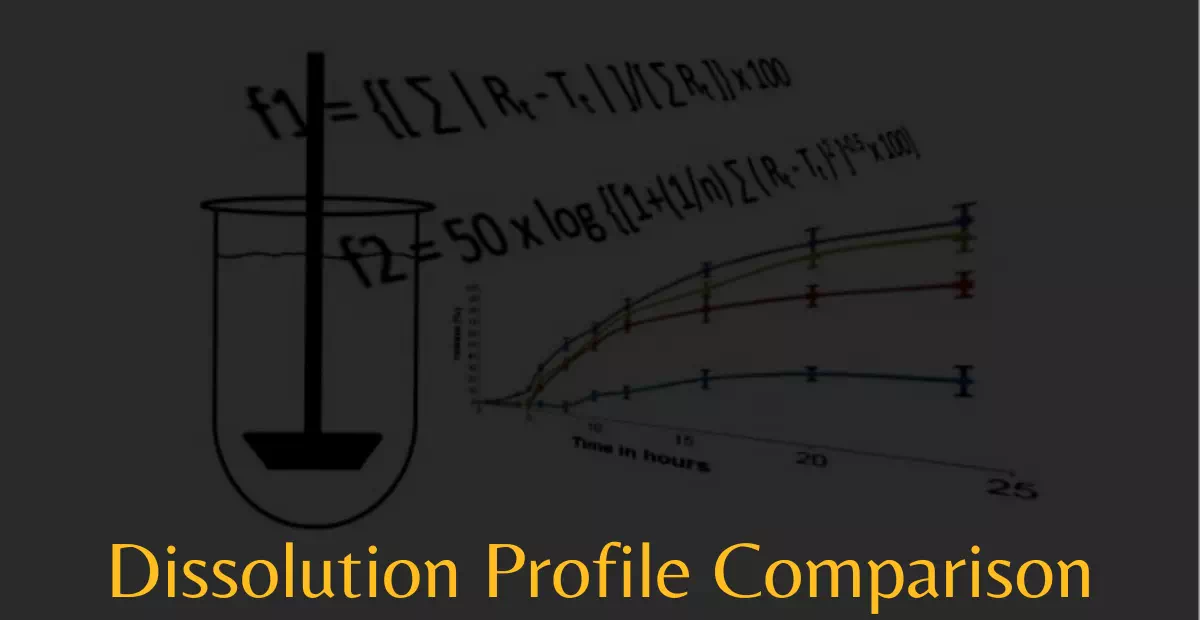
Difference factor (f1)
Difference factor (f1) is the percent (%) variance among the graphical lines at different time points. The value is used to predict comparative variations among the two graphical lines (curve):
Definition as per FDA guideline:

Similarity factor (f2)
Similarity factor (f2) measures comparison of percent (%) dissolution among two graphical lines (curves).
It is a “Log-reciprocal-square-root conversion of the sum-of-squared-error”.
Definition as per FDA guideline:

Where,
→ n denotes number of dissolution intervals
→ Rt indicated percentage release results of the reference (before change) lot at time-point t,
→ Tt indicated percentage release results of the lot under evaluation (before change) lot at time t.
1. Collect the dissolution-profile values of each time point of reference product or before changes in the formulation. Collect the values of the test product or after changes in the formulation for 12 units each.
2. Calculate the f1 (difference-fact0r) & f2 (similarity-fact0r) using the given calculation formulas.
When products are considered similar using f1 and f2 calculations?
f1 value: This values should near to 0 (Range from Zer0 to Fifteen))
f2 value: This should be near to 1oo (Range from Fifty to Hundred).
In above scenarios, the graphical lines (curve) can be considered as comparable and equivalent.
Different regulatory expectation on Dissolution Similarity Requirements
This section discusses international regulatory bodies’ expectations regarding the model-independent similarity factor approach to comparing dissolution profiles.
In this section, we have compared the following aspects associated with the similarity factor.
● f2 criteria for consideration of similarity
● Criteria for exemptions from f2 calculation
● Minimum number of time points required to calculate Similarity Factor (f2)
● Determination of the last time point for an f2 calculation
● Coefficient of variation criteria
Dissolution Similarity requirements and expectations from different regulatory bodies around the world
| Country | (Criteria for Exemptions from f2 Comparisons) Comparable without f1 and f2 calculation when dissolution is > 85% for test and reference products within 15 min | (Criteria for Exemptions from f2 Comparisons) Graphical curve using time point (Example 5, 10, 15, 20, and 30 min.) | (Criteria for Exemptions from f2 Comparisons) The variation at the 15 min. point should not exceed 10% | (Criteria for Exemptions from f2 Comparisons) When reference drug mean dissolution of 85% in 30 min (rapid dissolution), test drug must comply the same | Minimum number of time points | Determination of the Last Time Point for an f2 Calculation | Coefficient of Variation Criteria |
| US | Yes | Yes | Yes | Yes | Three | NMT one mean value >85% between test and reference drugs | At earlier time point NMT 20%, other time points NMT 10% |
| EU | Yes | Yes | Yes | Yes | Three (zero excluded) | Any one of the reference or test product has reached 85% dissolution (or asymptote is reached) | First time point NMT 20%, other time points NMT 10% |
| Thailand | Yes | Yes | Yes | Yes | Three | NMT one mean value >85% between test and reference drugs | NMT 10% from second to last time points |
| Russia | Yes | Yes | Yes | Yes | Three (zero excluded) | Any one of the reference or test product has reached 85% dissolution (or asymptote is reached) | First time point NMT 20%, other time points NMT 10% |
| Turkey | Yes | Yes | Yes | Yes | Three (zero excluded). | Any one of the reference or test product has reached 85% dissolution (or asymptote is reached) | First time point NMT 20%, other time points NMT 10% |
| South Africa | Yes | Yes | Yes | Yes | Three | NMT one mean value >85% between test and reference drugs | Earlier time points NMT 20%, other time points NMT 10% |
| China | Yes | Yes | Yes | Yes | 3 (zero excluded) Note 1 | Drug dissolution is allowed to reach > 90% only in one time point | First time point NMT 20%. Other time points NMT 10% |
| South Korea | Yes | Yes | Yes | Yes | Note 2 | The reference drug reached 85% dissolution | NMT 15% at all the time points |
| Canada | Yes | Yes | Yes | Yes | Until 90% of drug is dissolved or an asymptote is reached | Drug product reach the dissolution mean of 85% | Earlier time points NMT 20%, other time points NMT 10% |
| Australia | Yes | Yes | Yes | Yes | Three (zero excluded). | Any one of the reference or test product has reached 85% dissolution (or asymptote is reached) | First time point NMT 20%. Other time points NMT 10% |
| Mexico | Yes | Yes | Yes | Yes | Five Note 3 | The reference drug reached 85% dissolution | First time point NMT 20%, other time points NMT 10% |
| Brazil | Yes | Yes | Yes | Yes | Five (zero excluded) | NMT one mean value >85% between test and reference drugs | First 40% of time points are considered earlier time points – NMT 20%, other time points should be NMT 10% |
| India | Not specified | Not specified | Not specified | Not specified | Suitably spaced time points to achieve virtually complete dissolution | Achieve virtually complete dissolution | Not specified |
| Japan | Note 4 | Note 4 | Note 4 | Note 4 | Note 5 | The reference drug has reached 85% dissolution. Drug substance: percent dissolved at final time point (or first point of plateau is acceptable) | The absolute difference of mean is applied in the Japanese guidance |
NMT – Not More Than
Note 1:
Time points until drugs undergo more than 90% dissolution or reaches dissolution platform
Note 2:
•If the mean dissolution rate of reference drug is NLT 85% within 15~30 min: 15, 30, 45 min (three time points).
•If the mean dissolution rate of reference drug is not less than 85% after 30 min but within specified test time: Ta/4, 2Ta/4, 3Ta/4. Ta, where Ta is the time point when the mean dissolution rate of reference drug is approximately 85%.
•If the mean dissolution rate of reference drug is less than 85% within the specified test time: Ta/4, 2Ta/4, 3Ta/4. Ta, where Ta is the time point when the mean dissolution rate of reference drug is approx. 85% with the test time.
Note 3:
Only two points will be on the plateau of the curve and the other three will be distributed between the ascending stage and the inflection stage.
Note 4:
Detail descriptions of the exemptions are provided in the Japanese Guideline for Bioequivalence Studies.
Note 5:
% Dissolution ≥85% in 15–30 min: three time points.
% Dissolution is ≥85% at 120 min in pH 1.2 and 360 min in other media: four time points.
% Dissolution is 50–85% between 30 and 120 min in pH 1.2 and 30-360 min in other media: eight time points.
% Dissolution <50% between 30 and 120 min in pH 1.2 and 30-360 min in other media: eight time points.
Recommendations as per US FDA Guidance on dissolution profile similarity
As per the FDA guidance, following should keep in mind when we tend to compare two dissolution profiles:
→ For reference and test lots, use a precisely similar experimental environment.
→ The time-p0ints for the lots under comparison during the profiling should be exactly equal (For example 5, 10, 20, 35, 40, 60 minutes).
→ Newly produced lot is preferable and advisable for equivalency for before change data.
→ 0nly 0ne value should be used after getting Eighty Five Percent of release during the dissolution of before change and after change lot.
→ When using mean data, % coefficient-of-variation, initial value of profiling (e.g., 10-minutes) cannot > 2o%, and at the remaining release interval, it should not be > 1o%.
→ The average drug release results for Rt may be considered either from (1) last before-change lot (reference-lot) or (2) last 2 or more successively produced before change lots.
Advantages of difference-factor (-f1-) and similarity-factor (-f2-) calculation:
→ Easy to calculate
→ Easy to interpret the results based on single number
Disadvantages of difference-factor (-f1-) and similarity-factor (-f2-) calculation
→ The values, f1 and f2 are highly dependent on how many time points are taken into the consideration hence; it is sensitive time point numbers
→ The formulas do not take variability in account or relationship in the values
Applications of Dissolution Profile Comparisons (f1 and f2)
→ New ANDA submission
→ Filing variation to the original submission CBE filings
→ Formula changes
→ To waive the requirement of bioequivalence for smaller strengths of formulation
→ Site transfer
→ Scale up of the lots
→ In all the above cases, as an organization and good practice, the comparison should be considered. Also when we do regulatory submission, this is an expectations of regulators
Link for Free Excel Sheet to Calculate f1 and f2 values
Link for Online tool to Calculate f1 and f2 values
Reference
1. Therapeutic Goods Administration (TGA), Australia, http://www.tga.gov.au/
2. National Health Surveillance Agency (ANVISA), Brazil, http://www.anvisa.gov.br/
3. Health Canada, Canada, http://www.hc-sc.gc.ca/
4. National Institute for the Control of Pharmaceutical and Biological Products, China, http://www.nicpbp.org.cn/cmsweb/
5. European Medicines Agency (EMA), Europe, http://www.ema.europa.eu/
6. Central Drugs Standard Control Organization (CDSCO), India, http://cdsco.nic.in/
7. Pharmaceuticals and Medical Devices Agency (PMDA), Japan, http://www.pmda.go.jp/
8. Ministry of Health, Mexico, http://www.salud.gob.mx/
9. Ministry of Health, Russia, http://government.ru/
10. Ministry of Public Health, Thailand, http://eng.moph.go.th/
11. Ministry of Health, Turkey, http://www.saglik.gov.tr/
12. Medicines Control Council (MCC), South Africa, http://www.mccza.com/
13. Ministry of Food and Drug Safety (MFDS), South Korea, http://www.mfds.go.kr/
14. US Food and Drug Administration (FDA), United States, http://www.fda.gov/
15. Guidance for Industry, Dissolution Testing of Immediate Release Solid Oral Dosage Forms
Other Helpful information for pharma professionals
1. Standard Operating Procedure for Warehouse
2. Standard Operating Procedure for Human Resource and Administration
4. Mean Kinetic Temperature and Temperature Excursions
5. GMP and Regulatory Inspections – Practical advice for preparation and readiness