
Useful 280+ Pharmaceutical Quality Control Interview Questions and Answers
Quality Control Interview Questions listed in this article are the most commonly asked topic during the quality control laboratory interview for the pharmaceutical industry and chemical industry. In this article we tried cover pharmaceutical industry’s most widely used technique of analysis.
You will find interview questions and answers on Basics chemistry terminology of concentration calculations, Stability Studies, UV/ Visible spectrophotometry, Fluorescence Spectroscopy, Mid and Near Infrared Spectroscopy, Raman Spectroscopy, Thermal analysis techniques, Differential Scanning Calorimetry (DSC) and Thermogravimetric Analysis (TGA), Data handling in analytical chemistry, Weighing balance and weighing techniques, Volumetric glasswares, Titrations and standardization, Gas Chromatography (GC), Techniques of pharmaceutical analysis, Errors in pharmaceutical analysis, Significant figures, Pharmacopoeia, Impurities in the pharmaceuticals, Limit tests in the pharmaceuticals, Electrochemical methods of analysis in the pharmaceuticals, Karl fischer method for determination of water, Optical method of analysis, Nuclear Magnetic Resonance (NMR) spectroscopy, Emission spectroscopy, Flame Emission Spectroscopy (FES), Atomic Absorption Spectrophotometer, Thin-Layer Chromatography (TLC), and HPLC Interview Questions and troubleshooting and many other relevant and valuable quality control interview questions and answers.
The interview questions cover questions from basic to advanced levels of technical aspects. These quality control interview questions and answers will help crack an interview, enhance your knowledge, and also be helpful for the interviewer who is involved in the recruitment process.
You will find it much more enjoyable while going through these interview questions and answers. So enjoy learning and best of luck with your interview! Happy Learning
Pharmaceutical Quality Control Interview Questions and Answers
Basics chemistry terminology of concentration calculations
1. What is atomic weight for any element?
The atomic weight for any element is the weight of a specified number of atoms of
that element, and that number is the same from one element to another.
2. What is gram atomic weight for any element?
A gram-atomic weight of any element contains exactly the same number of atoms of that element as there are carbon atoms in exactly 12 g of carbon 12.
3. What is Avogadro’s number?
This number is Avogadro’s number, 6.022 × 10²³, the number of atoms present in 1 g-at wt of any element.
4. What is molecular weight?
The molecular weight is defined as the sum of the atomic weights of the atoms that make up a compound.
5. What is formula weight OR molar mass?
The term formula weight or molar mass is a description for substances that don’t exist as molecules but exist as ionic compounds (strong electrolytes—acids, bases, salts).
6. What is dalton?
Biologists and biochemists sometimes use the unit dalton (Da) to report masses of large biomolecules and small biological entities such as chromosomes, ribosomes, viruses, and mitochondria, where the term molecular weight would be inappropriate.
The mass of a single carbon-12 atom is equivalent to 12 daltons, and 1 dalton is therefore 1.661 × 10⁻²⁴ g, the reciprocal of Avogadro’s number. The number of daltons in a single molecule is numerically equivalent to the molecular weight (g/mol).
7. What is mole?
Mole is Avogadro’s number (6.022 × 10²³) of atoms, molecules, ions, or other species. Numerically, it is the atomic, molecular, or formula weight of a substance expressed in grams.
8. What is the formula for the number of moles of a substance?
Moles = grams/ formula weight (g/mol)
Millimoles= milligrams/ formula weight (mg/mmol)
9. How Do We Express Concentrations of Solutions?
Molarity
Normality
Formality
Molality
Density Calculations
10. What is Molarity?
The molarity of a solution is expressed as moles per liter or as millimoles per milliliter.
A one-molar solution is defined as one that contains one mole of substance in each liter of a solution. It is prepared by dissolving one mole of the substance in the solvent and diluting to a final volume of one liter in a volumetric flask.
11. What is Normality?
A one-normal solution contains one equivalent per liter.
An equivalent represents the mass of material providing Avogadro’s number of reacting units. A reacting unit is a proton or an electron. The number of equivalents is given by the number of moles multiplied by the number of reacting units per molecule or atom; the equivalent weight is the formula weight divided by the number of reacting units.
12. What is Formality?
Chemists sometimes use the term formality for solutions of ionic salts that do not
exist as molecules in the solid or in solution. The concentration is given as formal (F).
Operationally, formality is identical to molarity.
13. What is Molality?
A one-molal solution contains one mole per 1000 g of solvent. The molal concentration is convenient in physicochemical measurements of the colligative properties of substances, such as freezing point depression, vapor pressure lowering, and osmotic pressure because colligative properties depend solely on the number of solute particles present in solution per mole of solvent.
Molal concentrations are not temperature dependent as molar and normal concentrations are (since the solution volume in molar and normal concentrations is temperature dependent).
14. What is the difference between analyze and determine?
The terms analyze and determine have two different meanings. For example, a sample is analyzed for part or all of its constituents. The substances measured are called analytes. The process of measuring the analyte is called a determination.
15. What is Density Calculation?
Density is the weight per unit volume at the specified temperature, usually g/mL or g/cm3 at 20◦C. (One milliliter is the volume occupied by 1 cm3.)
16. What is Specific Gravity?
Specific gravity is defined as the ratio of the mass of a body (e.g., a solution), usually at 20◦C, to the mass of an equal volume of water at 4◦C (or sometimes 20◦C).
That is, specific gravity is the ratio of the densities of the two substances; it is a dimensionless quantity.
Since the density of water at 4◦C is 1.00000 g/mL, density and specific gravity are equal when referred to water at 4◦C. But normally specific gravity is referred to water at 20◦C; density is equal to specific gravity × 0.99821 (the density of water is 0.99821 g/mL at 20◦C).
Note: Density of solution at 20◦C = Specific gravity of solution × 0.99821 g/mL
17. What is the general formula for calculating percent on a weight/weight basis?

18. What is the formula for calculating parts per thousand (ppt), parts per million (ppm), or parts per billion (ppb)?
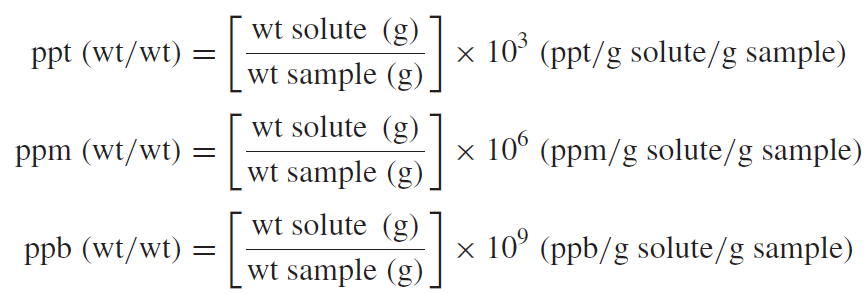
19. Explain the conversion from ppt (thousand), ppm, ppb, and ppt (trillion)?
1 ppt (thousand) = 1000 ppm =1, 000, 000 ppb; 1 ppm =1000 ppb = 1, 000, 000 ppt (trillion).
20. Explain the conversion from ppt (thousand), ppm, and ppb to weight/ weight?
ppt = mg/g = g/kg
ppm = μg/g = mg/kg
ppb = ng/g = μg/kg
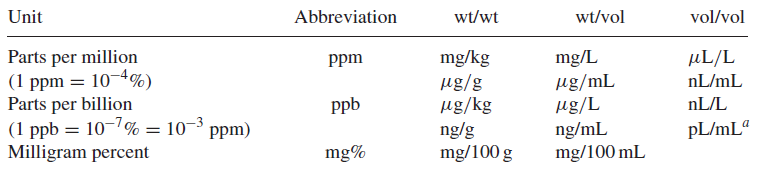
21. Explain the Common Units for Expressing Trace Concentrations?

22. What is the formula for calculating percent, parts per thousand (ppt), parts per million (ppm), or parts per billion (ppb)?

23. Explain the conversion from ppt (thousand), ppm, and ppb to weight/ volume?
ppm = μg/mL = mg/L
ppb = ng/mL = μg/L
ppt = pg/mL = ng/L
24. What is the formula to calculate the milliequivalents of a substance from its weight in milligrams?

25. Explain Volumetric Calculations using Molarity?
a. Calculation for Gram
M (mol/L) × L = mol
g = mol × fw (g/mol)
g = M (mol/L) × L × fw (g/mol)
b. Calculation for milligram
M (mmol/mL) × mL = mmol
mg = mmol × fw (mg/mmol)
mg = M (mmol/mL) × mL × fw (mg/mmol)
26. How to calculate the percentage of an analyte that reacts on a 1:1 mole basis with the titrant?
%Analyte = fraction of analyte × 100% = mg of analyte/ mg of sample X 100%
= mmol analyte × fw of analyte(mg/mol) X × 100% / mg of sample
= M of titrant(mmol/mL) × mL of titrant × fw of analyte(mg/mmol) × 100% / mg of sample
27. What is Gravimetric analysis?
Gravimetric analysis usually involves the selective separation of the analyte by precipitation, followed by the very nonselective measurement of mass (of the precipitate).
28. What is volumetric, or titrimetric analysis?
In volumetric, or titrimetric, analysis, the analyte reacts with a measured volume of reagent of known concentration, in a process called titration.
29. What is Analytical Method Validation?
Analytical methods validation is a gauge taken to prove that the analytical methods employed for a specific test will produce results that consistently meet Predetermined specifications.
30. What is the impact of the unauthorized change in the analytical methods?
Changes in laboratory analytical methods may impact product quality and Regulatory commitments
31. What is the must before implementation of revised analytical method?
To implement the revised method, change control system requires and while proposing the change, revalidating the method prior to implementation of the change and release of product using the method is essential.
32. Which should be the minimum required document in the analyst training file?
Training files for laboratory analysts must contain the following a. SOP training documentation b. Analytical methods/ quality manuals training, and c. Analytical instrument training
33. Why Accuracy and precision is essential to be proved for the laboratory instruments?
The accuracy and precision of the analytical instrument play a vital role in the pharmaceutical industry to obtain valid data.
34. What are the essentials to maintain the consistent performance and operation of an instrument to perform within the operating and validated range?
The Qualification, calibration and preventive maintenance activities allows for laboratory instrument to continuously operate within operating parameters.
35. What is the process to track and maintain the instrument within the calibration state?
Instrument calibration schedule.
36. What types of traceability is required for calibration standards for each piece of laboratory instrument?
Calibration standards must be traceable to national or international standards that are acceptable to respective regulatory bodies who approved the GPS status of the company.
37. What minimum information should be available on reagent Labeled?
All reagents are Labeled with the date of receipt, the date the bottle is opened and the initials of the person opening.
38. From where the current lot of pharmacopoeia standards shall be verified?
Availability of correct lot number of all pharmacopoeia standards shall be ensured by periodic review of the corresponding Pharmacopoeia forum.
39. What should be ensured while collecting/ using the sample for analysis?
Product manufacturers need to ensure that any sample taken for analysis is true representative of the product, sample size and sample locations in case of powders, granules and liquids.
40. What should be the basis for deciding a sampling plan?
A sampling plan must be established with scientific justification and statistical criteria such as confidence levels, component variability, degree of precision desired, and the past history of the supplier.
41. How much sample should be collected for Raw Material and Finished Products?
The amount of samples taken must be sufficient for the quantity needed for analysis, retesting in case of OOS and Retention sample requirement as per the regulations.
42. What is the ideal quantity of retention samples?
The retention samples must be of twice the quantity necessary for all tests required to determine that the active ingredient meets its established specifications.
43. What is the first stage of the procedure in laboratory investigation to determine if the OOS result is observed?
The first stage of the procedure in laboratory investigation is to determine if the OOS result is laboratory error?
44. When laboratory investigation is inconclusive, what is the next stage of investigation?
If the result of the initial laboratory investigation is inconclusive, a full-scale laboratory investigation is required to be performed.
45. When OOS occurs, what to do with samples and reagents?
All the samples and reagents will be retained until the investigation has been completed.
46. What is calibration?
Calibration is a comparison between measurements of known magnitude and measurement made in as similar a way as possible with a second device.
47. What is the purpose of calibration?
The purpose of the GMP calibration requirements is to assure adequate and continuous performance of measurement instrument with respect to Accuracy and Precision and other applicable parameters.
48. What are the Colors of Different Wavelength Regions? Which Wavelength absorb which color?
| Wavelength Absorbed (nm) | Absorbed Color | Transmitted Color (Complement) |
| 380–450 | Violet | Yellow-green |
| 450–495 | Blue | Yellow |
| 495–570 | Green | Violet |
| 570–590 | Yellow | Blue |
| 590–620 | Orange | Green-blue |
| 620–750 | Red | Blue-green |
49. Explain wavelength, frequency, and wavenumber?
- The wave is described in terms of its wavelength, the distance of one complete cycle
- The wave is described in terms of the frequency, the number of cycles passing a fixed point per unit time.
- The reciprocal of the wavelength is called the wavenumber and is the number of waves in a unit length or distance per cycle.
50. What should be the choice of Solvents for Spectrometry?
The solvent used to prepare the sample must not absorb appreciably in the wavelength region where the measurement is being made.
51. What is Spectrometric Instrumentation?
A spectrometer or spectrophotometer is an instrument that will resolve polychromatic radiation into different wavelengths and measure the light intensity at one or more wavelengths.
Stability Studies
52. What is the purpose of stability studies?
The main purpose of performing stability studies is to collect information regarding the impact that environmental factors may have over the quality of drug substances and products and to determine the shelf life of products in specific container closure system at recommended storage condition.
53. What are the stability testing intervals for long term stability studies?
Stability study testing for long term stability studies shall be performed every three months
over the first year, every six months over the second year and annually thereafter.
54. What is the zero time point for stability sample analysis?
The time “zero” is defined as the first testing of the initial samples at the time of release.
55. When will the intermediate stage stability study be started?
The stability study procedure should address the requirement that in case when significant change observed at 40°C, 75%RH, then a study at 30°C/60% RH must be initiated and continued for 12 months.
56. What are the typical tests carried out during the stability studies of Small-volume parenterals?
Small-volume parenterals shall be tested for strength, appearance, colour, particulate matter, pH, sterility, and pyrogenicity.
57. What are the typical tests carried out during the stability studies of topical preparations in containers larger than 3.5 g?
All topical preparations in containers larger than 3.5 g will be sampled and tested at the surface, middle and bottom of the container to ensure homogeneity throughout the shelf life.
58. What are the typical tests carried out during the stability studies of Respiratory inhalers?
For Respiratory inhalers the specifications and testing requirements include delivered dose per actuation, number of doses, colour, clarity (solutions), particle size distribution (suspensions), loss of propellant, pressure, valve corrosion, and spray pattern.
59. Which ICH guideline is applicable for stability studies of drug substance and drug products?
ICH Q1A(R2), STABILITY TESTING OF NEW DRUG SUBSTANCES AND PRODUCTS
60. Why are stability studies carried out?
The purpose of stability studies is to provide scientific and documented evidence of how the quality of a drug product or drug substance changes with time under the influence of various environmental conditions such as humidity, temperature, and light. The study will help to establish a re-test period for the drug substance and shelf life for the drug product along with the
recommended storage conditions.
61. According to the ICH guideline, World can be divided into how many climatic zones?
World can be divided into four climatic zones, I-IV.
62. What is Stress Testing?
Stress testing is the testing required to be done to identify the likely degradation products or material, which can help to understand the degradation pathways and the inherent stability of the API/ Formulation. This will also help to validate the stability indicating capability of the analytical method used.
63. What parameters should be considered for stress testing?
During the stress testing, the effect of temperatures, humidity, hydrolysis condition, oxidation condition and impact of photoenergy should be considered.
i. Temperatures should be verified in 10°C increments – for example, 50°C, 60°C, 70°C etc. i.e. above that for accelerated testing.
ii. Humidity (e.g., 75% RH or greater) where appropriate, oxidation, and photolysis on the drug substance.
iii.Hydrolysis across a wide range of pH values when in solution or suspension.
iv. Light intensity
64. How many batches to be considered for stability testing of drug substance?
At least three batches of the drug substance.
65. How to select the test to be carried out for stability studies?
Tests to be considered for stability studies for the attributes that are susceptible to change during storage and are likely to influence quality, safety, and/ or efficacy. Stability specification should cover testing of physical, chemical, biological, and microbiological attributes.
66. What should be considered during method validation of the test method applicable for stability testing?
Analytical method validation for stability studies should be proved for its stability-indicating characteristics.
67. What should be the stability study testing frequency for new drug substances and drug products?
For long term conditions: Every 3 months over the first year, every 6 months over the second year, and annually thereafter.
For accelerated storage condition: Minimum of 3 time points, including the initial and final time points (Example – 0, 3, and 6 months).
Intermediate storage condition: This study shall be started if a result of significant change is observed at the accelerated storage condition. Minimum of 4 time points requires, including the initial and final time points (Example: 0, 6, 9, 12 months) and 12 month study duration is recommended.
68. What are the storage conditions for stability study for general case studies as per ICH Q1AR2?
Long term* – 25°C ± 2°C/60% RH ± 5% RH or 30°C ± 2°C/65% RH ± 5% RH (Minimum duration: 12 months)
Intermediate** – 30°C ± 2°C/65% RH ± 5% RH (Minimum duration: 6 months)
Accelerated – 40°C ± 2°C/75% RH ± 5% RH (Minimum duration: 6 months)
* It is up to the applicant to decide whether long term stability studies are performed at 25 2°C/60% RH 5% RH or 30°C 2°C/65% RH 5% RH.
**If 30°C 2°C/65% RH 5% RH is the long-term condition, there is no intermediate condition.
69. What are the storage conditions for stability study for the drug substances intended for storage at a refrigerator as per ICH Q1AR2?
Long term 5°C ± 3°C (Minimum duration: 12 months)
Accelerated 25°C ± 2°C/60% RH ± 5% RH (Minimum duration: 6 months)
70. What is the meaning of Significant change for drug substance?
The Significant change for a drug substance means failure to meet its specification.
71. How to deal with Significant change occurring at accelerated storage conditions during stability study for the drug substances intended for storage at a refrigerator?
When significant change observed between 3 and 6 months’ period at the accelerated condition, the re-test period should be proposed based on the long term data.
When, significant change observed within the 3 months’ study at the accelerated condition, it should be studied for potential effect of short term excursions outside the label storage condition, which could occur during storage, or shipping.
Short term study (less than 3 months with more frequent testing should be carried out, that would serve as a basis for justification for short term excursions outside the label storage condition.
72. What are the storage conditions for stability study for the drug substances intended for storage at a freezer as per ICH Q1AR2?
Long term – 20°C ± 5°C (Minimum duration: 12 months)
73. How to deal with Significant change occurring at accelerated storage conditions during stability study for the drug substances intended for storage at a freezer?
Since no accelerated stability study is guided in ICH guidelines for this storage condition, study on a single batch at an elevated temperature should be considered for data generation, for example, at 5°C ± 3°C or 25°C ± 2°C for a suitable time period. The purpose of the study is to address the effect of short term excursions outside the label storage condition that may occur during storage or shipping.
74. How is the stability study helpful in defining Labeling?
The statement regarding the storage condition of drug substance/ drug product should be based on the stability studies. Precautions should be added on the label based on the generated data, example, drug substances cannot tolerate freezing temperature.
75. What is the importance of Container Closure System in drug product stability study?
Stability testing for the drug product must be done with packaging material that are intended to market (including, as appropriate, any secondary packaging and container label). Container closure used for stability study should not be different from market pack, as container closure plays a vital role in protecting the quality of drug products.
76. What is a significant change for drug products?
Significant change for a drug product means:
1. A 5% change in assay from its initial results; or failure to meet the specification for potency when using immunological or biological procedures;
2. Any degradation product/ impurity or related substance exceeding its acceptance criterion;
3. Failure to meet the acceptance criteria for physical attributes, appearance, and functionality test (For example, phase separation, color, resuspendibility, hardness, caking, dose delivery per actuation); however, some changes in physical attributes may be expected under accelerated conditions; for example, melting of creams and softening of suppositories.
4. Failure to meet the acceptance criterion for pH; or
5. Failure to meet the acceptance criteria for dissolution for 12 dosage units.
77. What is the requirement of stability study for the drug products packaged in impermeable containers?
Stability studies for the drug product stored in impermeable containers can be done at any controlled or ambient humidity condition. (Note: Potential for solvent loss or Sensitivity to moisture is not an issue for drug products packed in impermeable containers as it provides a permanent barrier to passage of moisture or solvent.)
78. What is the additional requirement of stability study for the drug products packaged in semi-permeable containers?
When aqueous-based drug products are packed in semi-permeable containers, it should be evaluated for possibility of water loss in addition to other tests considered for stability studies.
79. What are the stability conditions considered for the drug products packed in semi-permeable containers?
Long term* 25°C ± 2°C/40% RH ± 5% RH or 30°C ± 2°C/35% RH ± 5% RH (Minimum Period: 12 months)
Intermediate** 30°C ± 2°C/65% RH ± 5% RH (Minimum Period: 6 months)
Accelerated 40°C ± 2°C/not more than (NMT) 25% RH (Minimum Period: 6 months)
*Applicants need to decide based on development data and region to where to be marketed for long term stability studies that are performed at 25 2°C/40% RH 5% RH or 30°C 2°C/35% RH 5% RH.
**If 30°C ± 2°C/35% RH ± 5% RH is the long-term condition, there is no intermediate condition
80. What is the significant change for loss in water for drug product packaged in a semi-permeable container?
A 5% loss in water from its initial value is considered a significant change for a product packaged in a semi-permeable container.
81. When 5% loss in water from its initial value may be considered justification for drug products packaged in a semi-permeable container?
For small containers (1 mL or less) or unit dose products, a water loss of 5% or more after an equivalent of 3 months’ storage at 40°C/NMT 25% RH may be appropriate, if justified.
82. Is intermediate stability testing needed when significant change for loss in water for drug products packaged in a semi-permeable container is observed?
A significant change in water loss alone at the accelerated storage condition does not necessitate testing at the intermediate storage condition.
83. What is Bracketing when referring to stability study?
Stability study design when only samples on the extremes of certain design factors, for example, strength, package size, are tested at all time points as in a full design called as Bracketing
84. Which ICH guidelines are applicable for Stability Testing?
ICH Q1A(R2): “Stability Testing of new drug substance and products”
ICH Q1B: “Photostability Testing of New Drug Substances and Products”
ICH Q1C: “Stability Testing of New Dosage Forms”
85. Why is photostability important?
To evaluate and demonstrate the impact of light exposure whether light exposure to the drug product or drug substance is resulting in unacceptable change or not.
86. Photostability testing is carried out on how many batches?
Photostability testing is carried out on a single batch.
87. As per ICH Q1B, what is the systematic approach to photostability testing?
A systematic approach to perform photostability testing is:
(i) Tests on the drug substance.
(ii) Tests on the exposed drug product outside of the immediate pack.
(iii) Tests on the drug product in the immediate pack.
(iv) Tests on the drug product in the marketing pack.
88. Which light sources are used for the photostability studies?
ICH Q1B, following are the two sources:
Option 1 – Light source that produces an output similar to the D65/ID65 emission standard. Example, artificial daylight fluorescent lamps combining visible and ultraviolet (UV) outputs, xenon, or metal halide lamp. For a light source emitting significant radiation below 320 nm, an appropriate filter(s) may be fitted to eliminate such radiation.
D65 is the internationally recognized standard for outdoor daylight as defined in ISO 10977 (1993).
ID65 is the equivalent indoor indirect daylight standard.
Option 2 – Same sample to be exposed to both the cool white fluorescent and near ultraviolet lamp.
1. A cool white fluorescent lamp produces an output specified in ISO 10977(1993) ;
2. A near UV fluorescent lamp having a spectral distribution from 320 nm to 400 nm with a maximum energy emission between 350 nm and 370 nm; a significant proportion of UV should be in both bands of 320 to 360 nm and 360 to 400 nm.”
Reference: STABILITY TESTING: PHOTOSTABILITY TESTING OF NEW DRUG SUBSTANCES AND PRODUCTS Q1B
89. How to perform photostability testing of drug substances and drug product?
Photostability testing of drug substances and drug product consist of two parts -forced degradation (FD) testing and confirmatory testing.
The objective of FD testing is to evaluate the photosensitivity of the material for method development purposes and to understand the degradation pathway.
The objective of confirmatory studies are done to get the information necessary for handling, packaging, and labeling of drug substances.
90. How many batches shall be considered for the photostability of drug substance and drug product?
Generally one batch is tested during the development phase, and it is confirmed on a single batch. If the results of the confirmatory study are ambiguous, additional two batches should be considered for the study.
UV/ Visible spectrophotometry
91. What is the principle of UV/ Visible spectrophotometry?
The absorbance measured for an analyte can be linearly related to concentration (Lambert-Beer’s law).
92. What range of ultraviolet-visible (UV-vis) wavelengths are useful for UV-visible spectrophotometry?
Pharmaceutical applications of ultraviolet-visible (UV-vis) spectrophotometry concern light in the wavelength range 190–800 nm.
Ultraviolet (UV) range is from 190 to 400 nm
Visible region, recognized by the human eye, is from 400 to 800 nm.
93. What is Lambert-Beer’s Law?
Lambert law: Each layer of the medium through which the light is passing absorbs an equal fraction of light which is independent of the intensity of the incident light; thus, along the light path there is an exponential decay in the light intensity.
Beer’s law: Amount of light absorbed is proportional to the number of chromophores present in the medium that the light is passing through. It means the amount of absorbed light is proportional to the concentration of the absorbing species (chromophores).
94. What are the factors which influence the absorbance of molecules?
Absorbance of a molecule is dependent on the solvent, pH, molecular interactions, and temperature in addition to structure and wavelength.
These two laws are often combined into what is often referred to as Lambert-Beer’s,
Beer-Lambert’s or simply Beer’s law.
95. What are the factors which cause Deviation from Lambert-Beer’s Law and are the Sources of Error to induce deviation from the law?
Causes for deviation from Lambert-Beer’s law may be of chemical as well as instrumental origin
- At high drug or analyte concentrations (typically >0.01 M) causes deviations from linearity due to refractive index changes and because the close proximity of the absorbing molecules will affect their charge distribution and lead to alterations in their absorptivity.
- Particles present in the sample lead to light scattering.
- Polychromatic radiation
- Stray light. This light reaches the detector without having passed through the sample due to light scattering within the instrumentation or light entering from outside the instrument. The tray light will give negative deviations from Lambert-Beer’s law.
96. Why normally UV absorbance is measured at absorption maximum?
For quantitative analysis, a relatively narrow wavelength range where there is only a small change in absorptivity is selected which is normally found at the absorption maximum.
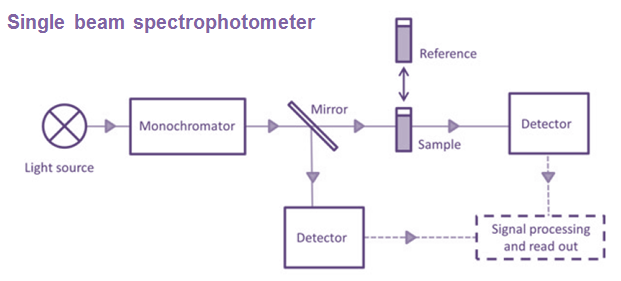
97. Explain the Instrumentation or basic components for UV/Visible spectrophotometry?
The basic components for UV/Visible spectrophotometry include a light source, a wavelength selector, a sample compartment (often a cuvette or flow cell) and a detector.
98. Explain which basic types of detectors are used in UV/Visible spectrophotometry?
Two basic types of detectors are used:
- Photomultiplier tubes
- Semiconductors
99. What are the types of UV/ Visible spectrophotometers?
- Single beam spectrophotometer
- Double beam spectrophotometer
- Array detector spectrophotometer


100. What are the applications of UV/Visible Spectrophotometry?
Applications of UV/Visible Spectrophotometry are:
- Qualitative Analysis
- Quantitative Analysis
- Quantitative Analysis – Use in physicochemical profiling of drug substances such as pKa determination and kinetic studies, Equilibrium Constants and Complexation – can be applied broadly to the characterization of equilibria and complexation phenomena, Kinetics and Reaction Monitoring, Dissolution Testing
Fluorescence Spectroscopy
101. What is Luminescence?
Luminescence is the spontaneous emission of radiation from a substance. Emission of radiation from species in electronically (or vibrationally) excited states not in thermal equilibrium with its environment.
102. What is Fluorescence Spectroscopy?
Fluorescence spectroscopy uses a light source to excite electrons in molecules and it emits light in visible range. The emitted light is detected using a detector for measurement and identification of the molecule. The concentration of solution is directly proportionate to the detector response.
103. What are the types of Luminescence?
The types of luminescence are classified according to the mode of excitation.
- Photoluminescence: When electromagnetic radiation (photons) energy gets absorbs, it emits Luminescence. Examples of Photoluminescence are:
- Phosphorescence: This is a delayed reaction. This happens when emission of photons is trapped in a ‘forbidden’ state. This action happens in milliseconds to hours.
- Fluorescence: This happens when rapid emission of photons as electrons jump from excited state to ground state.The actions happen in nanoseconds.
- Chemiluminescence: When chemical reaction emits Luminescence. Examples of Chemiluminescence are:
- Electrochemiluminescence: It occurs because of electrochemical reactions
- Bioluminescence: It occurs because of biochemical reactions in living organisms (For example – fireflies).
- Crystalloluminescence: Luminescence occurs while crystallization – This occurs when solid crystals precipitate from a solution, a molten material or deposited directly from a gas.
- Electroluminescence: Luminescence occurs while electric current passes from a substance. Type of Electroluminescence is Cathodiluminescence. This happens when electrons strike with a luminescent material.
- Mechanoluminescence: Luminescence occurs because of mechanical actions:
- Triboluminescence: Luminescence occurs when material is crushed, scratched, or rubbed. During this action, bonds in a material are broken when that
- Fractoluminescence: Luminescence occurs when bonds in crystals are broken by fractures.
- Piezoluminescence: Luminescence occurs when pressure generates on solids.
- Sonoluminescence: Luminescence occurs when imploding bubbles in a liquid whenever it is excited by sound
- Radioluminescence: Luminescence occurs by bombardment with ionizing radiation
- Thermoluminescence: Luminescence occurs on re-emission of previously absorbed energy while a substance is heated
Mid and Near Infrared Spectroscopy
104. What is the infrared (IR) spectroscopy spectral range?
Infrared (IR) spectroscopy has a spectral range between 12,500 and 20 cm-1. It is further subdivided in the:
- Far-IR (FIR: 400–20 cm-1)
- Mid-IR (MIR: 4000–400 cm-1)
- Functional group region (4000-1300 cm-1)
- Fingerprint region (1300-400 cm-1):
(Reference: https://byjus.com/chemistry/infrared-spectroscopy/)
- Near-IR (NIR: 12,500–4000 cm1)

Reference of diagram: https://chem.libretexts.org/Bookshelves/Organic_Chemistry/Map%3A_Organic_Chemistry_(Wade)/11%3A_Infrared_Spectroscopy_and_Mass_Spectrometry/11.05%3A_Infrared_Spectra_of_Some_Common_Functional_Groups
105. What is the principle of infrared (IR) spectroscopy?
When a molecule is exposed to electromagnetic radiation in the infrared (IR) region, it matches the frequency of its vibrational modes, absorbs the energy and jumps to a higher vibrational energy state. The difference in energy between the two vibrational states is equivalent to the energy associated with the wavelength of radiation that was absorbed. In this situation, the infrared region of the electromagnetic spectrum contains frequencies corresponding to the vibrational frequencies of organic bonds.
Absorbance in the MIR range originates from two types of fundamental vibrations, namely stretching and bending.
106. How is infrared (IR) spectroscopy provided information about the structure of a compound?
Answer: 1
The absorption of infrared radiation by a molecule causes changes in their vibrational and rotational energy levels, therefore, IR-spectroscopy is also known as vibrational-rotational spectroscopy. Similar to the UV-spectroscopy, very few peaks in their spectrum, IR spectroscopy provides a spectrum with a large number of absorption bands. Therefore, it provide plenty of information about the structure of a compound. Different bonds present in the spectra correspond to various functional groups and bonds present in the molecule.
Answer: 2
Frequency and intensity of the absorbed radiation depend on the strength of the bond, the atoms the molecule is composed of, the extent of the dipole moment change and the chemical environment. Hence, position, intensity and width of MIR absorption peaks provide information about the molecular structure of the sample including inter- and intramolecular interactions such as hydrogen bondings.
It deals with the absorption of radiation in the infrared region of the electromagnetic spectrum. IR spectrum gives sufficient information about the structure (identification of functional groups) of a compound and can also be used as an analytical tool to assess the purity of a compound.
107. What are the characteristics of mid and near infrared spectroscopy?
| Mid infrared spectroscopy | Near infrared spectroscopy | |
| Vibrations | Fundamentals | OvertonesCombinations |
| Wavenumber range | 4000–400 cm-1 | 12,500 –4000 cm-1 |
| Radiation (Light source) | Polychromonatic radiation (Globar tungsten) | Polychromonatic radiation (Globar tungsten) |
| Spectral principle | Absorption | Absorption |
| Absorption coefficient | High | Low |
| Absorbance peaks | Numerous and well resolved | Broad and overlapped |
| Selection rules | Change in dipole moment | Change in dipole momentAnharmonicity |
| Functionalities | Polar groups | X-H groups (i.e. CH/OH/NH groups) |
| Structural selectivity | High | Low |
| Quantitative measurements | Beer’s law | Beer’s law |
| Sample preparation | Dilution required (e.g. KBr)(except ATR-IR) | Not required |
| Sample size | Small volume (μl)Low thickness (μm) | LargeThickness up to cm |
| Monochromator Detection principles | FT-IR | GratingFT-IRAOTFDiode-array |
| Light-fiber optics | Chalcogenide or AgCl (<10m)Limited | Quartz (>100m) |
| Probes | ATR (attenuated total reflectance) | TransmissionTransflectionDiffuse reflectance |
108. What are the Infrared spectral regions within the electromagnetic spectrum?

109. What is the Functional group region (4000-1300 cm-1) and what is the significance?
In the functional group region (4000-1300 cm-1), most of the functional groups present in organic molecules exhibit absorption bands, therefore it is called a functional group region.
110. What is the Fingerprint region (1300-400 cm-1) and what is the significance?
The region from 1300-400 cm-1 has a complicated series of absorptions. These are mainly because of molecular vibrations, generally bending motions that are characteristic of the entire molecule or large fragments of the molecule.
Two different compounds will have different absorption patterns in this region except enantiomers. Therefore, the absorption patterns are unique in this region for any compound. For that reason, this region is called the fingerprint region.
111. Why Functional group region (4000-1300 cm-1) and Fingerprint region (1300-400 cm-1), both have an importance?
Two molecules having the same functional group could show the same spectra in the functional group region, however, their spectra differ in the fingerprint region. Therefore both the regions are very useful for confirming the identity of a chemical substance.
112. How are the sample preparations done for infrared spectroscopy?
Materials are available in the different forms for which the IR spectrum is recorded. The compounds are available in liquid, solid, gas and solution form.
Not all materials are transparent to IR rays, and few of them are opaque to IR radiation. Therefore, to obtain spectra, compounds must be dissolved or diluted in a transparent matrix.
Alkyl halides are compounds that are transparent to the IR region. The compound has the structure of C–X bond, where X is a halogen: bromine, chlorine, fluorene, or iodine. Generally the frequency of these bonds appear in the region 850-515 cm-1, which are out of the range of typical IR instrumentation.
Generally, the materials used for matrix (i.e. NaCl, KBr) are absorbs the moisture and water absorb IR rays near 3710 and 1630 cm-1 therefore the samples should be perfectly dried before utilization for the IR analysis,
(1) Solid samples: Solid samples are prepared using various methods, which are described as follows:
(i) Pressed disc: Solid sample is mixed with KBr and translucent pellet of this powder mixture is formed by pressing using mechanical pressure. KBr is transparent to IR radiation ranging from 4000-650 cm-1 hence, it gives adequate spectra without any interference. The demerit of using KBr is, it absorbs moisture quickly and that would interfere with the spectra.
(ii) Mull or paste: Sample is powdered and mixed with an oily mulling agent (typically
Nujol). The mixing is done with the help of mortar and pestle. A thin film of the mull is created, kept in between flat plates of NaCl and IR spectrum is recorded.
This method has demerit that nujol absorptions bands at 1380 cm-1, 1462 cm-1 and 2924-2860 cm-1, therefore no information about the observed compound can be obtained in this region.
(iii) Film: Dissolve the solid sample in non-hygroscopic solvent such as Carbon tetrachloride or Methylene chloride.
A drop of the above solution is deposited on the surface of the KBr or NaCl plate. The plate is dried by evaporation and film is formed. This KBr disc is used to obtain the IR spectrum.
(2) Liquid samples: Liquids are studied in solution or neat. A drop of neat liquid sample or a solution of the sample is kept between two plates of a NaCl or KBr to obtain a thin film. It is then analysed to obtain the spectrum.
The NaCl or KBr plates tend to break very easily and those are water soluble, hence, compounds to be analyzed must be free from water.
The spectra obtained using this method is also called as neat spectrum because no solvent is used while recording the spectrum.
(3) Gaseous samples: The gas is passed into a specially designed cell having a long path length (around 10 cm). The two side walls of the and the cell are made up of NaCl. The cell is placed inside the IR spectrophotometer to record the spectra.
113. What are the sampling techniques for measurements in the mid-IR?
There are three main sampling techniques for measurements in the mid-IR
(a) Transmission – Transmission measurements are useful with liquid and solid samples. Because of the high absorbance coefficient in the mid-IR region, solid samples are diluted with a non-absorbing substance such as KBr and pressed into a pellet.
(b) Attenuated total reflectance (ATR): In ATR technique, the sample is kept in direct contact with an internally reflecting material with a high index of refraction (e.g. ZnSe). The ray is transmitted through the ATR element is reflected at the crystal/ sample interface, thereby penetrating a few microns into the sample.
(c) Diffuse reflectance (DRIFT): In a DRIFT technique, the IR radiation reflected from rough sample surfaces is collected. The incident light is partly reflected by the sample surface (i.e. specular reflectance), partly scattered, and partly transmitted into the sample. The transmitted part may be absorbed or diffracted, resulting in diffusely scattered light.
Contrary to the specularly reflected part, which is usually eliminated by the DRIFT accessory, the diffuse reflected light collected over various angles thus contains absorptivity information from the sample. Due to the measurement principle, DRIFT spectroscopy can be used for noninvasive evaluation of solid samples including characterization of polymorphic forms.
114. What is Near infrared spectroscopy (NIR)?
Near infrared spectroscopy (NIR) is a technique of infrared spectroscopy where the spectrum of material is acquired by interaction between electromagnetic radiation and matter, within the wavelength range of 800 – 2500 nm or 12500 – 4000 cm-1. The IR radiation is absorbed those are related to different properties of the sample and provide quantitative and qualitative information.
The NIR range represents by weak overtones and combined bands emerged from the strong fundamental vibrations of C-H, O-H, C-O, C=O, C=O, N-H bonds and metal-OH groups in the mid-IR range.
115. What are the applications of NIR technology?
- Raw material identification
- Reaction Monitoring
- Crystallization
- Molecular Characterization of Solid Dispersions
- Challenges of Particle Size Determination
- Nondestructive Tablet Hardness Testing
- Nondestructive Prediction of Dissolution Performance
- Simultaneous Determination of Multiple CQAs
- Evaluation of Protein Secondary Structural Changes and Beyond
- Challenges of Antibody Formulations
- Noninvasive Analysis of Polymeric Protein Delivery Systems
- Use as Real-Time PAT Tool in Batch and Continuous Drug Product Manufacture – Blending, Wet Granulation, Fluid Bed Granulation, High shear wet granulation, Twin screw granulation, NIR in Roller Compaction, Hot-Melt Extrusion, Pelletization, Tableting and Capsule Filling, Coating, Freeze-Drying
- In Vivo Applications – Medical Monitoring, Tissue Analysis
116. What are the Infrared Sources?
The most common infrared sources are electrically heated rods of the following types :
(a) Sintered mixtures of the oxides of Zirconium (Zr), Yttrium (Y), Erbium (Er) etc., also known as ‘Nernst Glower’,
(b) Silicon Carbide ‘Globar’, and
(c) Various ceramic (clay) materials.
117. What are the Monochromators used in infrared spectroscopy?
(i) Metal Halide Prisms
(ii) NaCl Prism (2-15 μm)
(iii) Gratings
118. What are the Detectors used in infrared spectroscopy?
(a) Thermocouples (or Thermopiles): The underlying principle of a thermocouple is that if two dissimilar metal wires are joined head to tail, then a difference in temperature between head and tail causes a current to flow in the wires. In the infrared spectrophotometer this current shall be directly proportional to the intensity of radiation falling on the thermocouple. Hence, the thermocouples are invariably employed in the infrared region, and to help in the complete absorption of ‘available energy’ the ‘hot’ junction or receiver is normally blackened.
(b) Golay Detector : In this specific instance the absorption of infrared radiation affords expansion of an inert gas in a cell-chamber. One wall of the cell-chamber is provided with a flexible mirror and the resulting distortion alters the intensity of illumination falling on a photocell from a reflected beam of light. Thus, the current from the photocell is directly proportional to the incident radiation.
(c) Bolometers : These are based on the principle that make use of the increase in resistance of a metal with increase in temperature. For instance, when the two platinum foils are appropriately incorporated into a Wheatstone bridge, and radiation is allowed to fall on the foil, a change in the resistance is observed ultimately. This causes an out-of-balance current that is directly proportional to the incidental radiation. Just like the thermocouples, they are used in the infrared region.
Raman Spectroscopy
119. What is Raman spectroscopy?
Raman spectroscopy is a technique in which scattered light informs on the nature of the irradiated sample. Inelastic or Raman scattering happens when the changes in energy occurs during the collision between the molecule and monochromatic light, therefore, the frequency of the scattered light also changes. These changes provide information about the molecular identity and structure of the samples or material being analyzed.
120. What are the applications of Raman spectroscopy?
a. Active Pharmaceutical Ingredient (API) identification
b. Qualitative and Quantitative analysis of formulations
c. Detection of illicit substances
d. Monitoring of continuous manufacturing
121. What are the different types of Typical Raman Spectra, its advantages, disadvantages and area of applications?
| Category | Advantages | Disadvantages | Areas of application |
| FT-Raman | Low Fluorescence interference, quick test speed | Poor reproducibility caused by baseline drift | Quality control of traditional Chinesemedicine, identification of food fat, study of crystal morphology |
| Surface Enhanced Raman spectroscopy (SERS) | High sensitivity, trace detection | SERS effect is observed ona few substrates | Trace chemical detection of drugs such as methimazole and cannabinoids |
| Raman microspectroscopy (Rl) | Less sample required, high sensitivity, large information | Fluorescence interference | Physicochemical stability of dosage form, such as ibuprofen and crystal form studies |
| Resonance Raman spectroscopy (RRS) | Less sample required, high sensitivity: | Fluorescence interference | Drug interactions such as the doxorubicin and calf thymus DNA |
Source: https://www.iris-eng.com/
Thermal analysis techniques, Differential Scanning Calorimetry (DSC) and Thermogravimetric Analysis (TGA)
122. Explain Differential Scanning Calorimetry (DSC).
Differential Scanning Calorimetry (DSC) is a thermal analysis technique. It provides qualitative and quantitative information as a function of time and temperature regarding thermal transitions in materials that involve endothermic or exothermic processes, or changes in heat capacity.
123. What are the types of Differential Scanning Calorimetry (DSC)?
With respect to instrumentation, there are two main types of DSC instruments, power compensation and heat flux.
- Conventional DSC
- Power compensation DSC: This involves two separate furnaces for the reference and for the sample. The common principle of power compensation DSC is to heat both the reference and the sample simultaneously in such a way that the temperature of the two is kept identical, and the difference in power required to maintain the temperature is measured.
- Heat flux DSC: This instrument uses two crucibles for the sample and for the reference within one furnace. They are both heated from the same source and the temperature difference between the sample and the reference over the heating profile is measured.
- Modulated Temperature Differential Scanning Calorimetry (MTDSC)
Conventional DSC mentioned above is a powerful tool to measure a wide range of
thermal events such as melting accurately. However it often struggles to distinguish
overlapping thermal events such as overlapped glass transitions and endothermic
relaxation events, which can occur within the similar temperature range for many
amorphous drugs and polymers. MTDSC was designed to separate overlapping thermal events. Compared with conventional DSC, where a linear heating rate is applied, in MTDSC the sample follows a heating rate commonly with a sinusoidal modulated wave, and the uses of square and sawtooth modulated waves have also been reported.
- Hyper DSC
High speed or high performance conventional DSC, also known as hyper DSC, operates at extremely fast heating rates from 200 ° C/min up to 750 ° C/min. Conventional DSC using slow (linear) heating rates (typically heating rate below 100 °C/min) can result in good resolution but poor sensitivity particularly for phase transitions that strongly affected by kinetic factors, whilst fast heating rates can result in poor resolution but good sensitivity. Fast heating rates have the same total heat flow signal as in a DSC or MTDSC experiment. However as transitions occur over a shorter time period, the signal response to the thermal event appears larger. One issue that can occur with conventional DSC with slow heating is that the heating process may alter the sample, before the thermal transition of interest is reached. Using fast heating rates these effects can be eliminated or reduced, allowing for the characterisation of samples in their “as received” state. This technique is also of particular advantage for materials possessing properties that may change upon prolonged exposure to increased temperatures like amorphous products or formulations of biological molecules.
124. What is Thermogravimetric Analysis (TGA)?
Thermogravimetric Analysis (TGA) is one of the oldest thermal analytical procedures and has been used extensively in the study of material science.
The technique involves monitoring the weight change of the sample in a chosen atmosphere (usually nitrogen or air) as a function of temperature.
The measurement is operated by applying a temperature programme to a closed sample furnace containing an electronic microbalance (for holding the sample), which allows the sample to be simultaneously weighed and heated in a controlled manner, and the mass, time and temperature to be captured.
125. What are the applications of Thermogravimetric Analysis (TGA)?
- TGA is generally used for thermal stability and volatile components analysis.
- Evaluation of processing temperatures of thermally based manufacturing processes such as hot melt extrusion.
- It can determine the thermal stability of the drugs and polymers upon heating to assist with selecting the operation temperature in hot melt extrusion to avoid thermal degradation occurring in process.
- To measure the moisture or residue solvent contents in processed materials.
- TGA coupled with spectroscopic detection methods such as gas chromatography (GC and GC-MS) to allow the chemical identification of the volatile material liberated from the sample.
126. What is Scanning Probe Based Thermal Analysis?
The coupling of thermal analysis with atomic force microscopy (AFM) gives the new generation of thermal analysis the capability to allow thermal measurement to be performed at the selected point of interest. Such a technique is often known as localized thermal analysis (LTA).
127. What are the Physical and Chemical Phenomena Commonly Investigated Using Thermal Approaches?
a. Crystallization
b. Polymorphic Transformation
c. Glass Transition
d. Molecular Mobility
e. Structural Relaxation
f. Dehydration and Decomposition
128. What are the applications of Thermal Analysis for the Characterisation of Pharmaceutical Raw Materials?
a. Amorphous Drugs
b. Pharmaceutical Polymers and Lipidic Excipients
c. Polymer Blends
Data handling in analytical chemistry
129. What is meant by Accuracy?
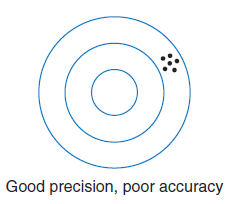
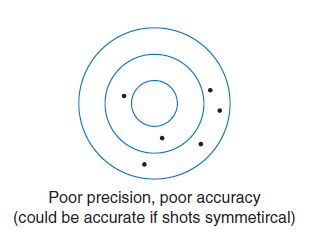
Accuracy is the degree of agreement between the measured value and the true value.
130. What is meant by Precision?
Precision is defined as the degree of agreement between replicate measurements.

131. What is meant by the number of significant figures?
The number of significant figures can be defined as the number of digits necessary to express the results of a measurement consistent with the measured precision.
Weighing balance and weighing techniques
132. What are the types of weighing balances used in the quality control laboratory?
Single-pan mechanical balance
Semimicro balance
Microbalance
133. Explain classification and nomenclature of modern laboratory balances used in the quality control laboratory?
The classification and nomenclature of modern laboratory balances follows a decimal pattern based on the step size d of the associated digital display:
(i) Precision balances: d= 1, 0.1, 0.01, or 0.001 g
(ii) (Macro) analytical balances: d = 0.1 mg
(iii) Semimicro balances: d=0.01 mg
(iv) Microbalances: d = 0.00 1 mg
(v) Ultramicrobalances: d = 0.000 I mg
134. What are the typical sensitivity of Semimicro and Micro balances ?
The semimicro balance is sensitive to about 0.01 mg, and the microbalance is sensitive to about 0.001 mg (1 μg).
135. What is zero point drift in weighing?
The zero setting of a balance is not a constant that can be determined or set and forgotten. It will drift for a number of reasons, including temperature changes, humidity, and static electricity. The zero setting should therefore be checked at least once every half-hour during the period of using the balance.
136. What is the benefit of weighing in vacuum?
Weighing in vacuum gives more accuracy than weighing in air.
137. Explain the general rules of weighing?
i. Never handle objects to be weighed with the fingers. A piece of clean paper or tongs should be used.
ii. Weigh at room temperature, and thereby avoid air convection currents.
iii. Never place chemicals directly on the pan, instead weigh them in a vessel (i.e. weighing bottle, weighing dish, etc.) or on powder paper.
iv. Always brush spilled chemicals off immediately with a soft brush.
v. Always close the balance case door before making the weighing. Air currents will cause the balance to be unsteady.
138. How is the weighing of hygroscopic solid materials done?
Hygroscopic samples are weighed with the bottle kept tightly capped. Weighing by difference is required for hygroscopic samples.
139. How is the weighing of liquid done?
Weighing of liquids is generally done by direct weighing. The liquid is transferred to a weighed vessel (Example – a weighing bottle), which is capped to prevent evaporation during weighing, and is then weighed If a liquid sample is weighed by difference by pipetting out an aliquot from the weighing bottle, the inside of the pipet must be rinsed several times after transferring. Care should be taken not to lose any sample from the tip of the pipet during transfer.
140. What are the sources of error in weighing?
- Changes in ambient temperature or temperature of the object being weighed are probably the biggest sources of error, causing a drift in the zero or rest point due to convection-driven air currents. Hot or cold objects must be brought to ambient temperature before being weighed.
- Hygroscopic samples may pick up moisture, particularly in a high-humidity atmosphere.
- Exposure of the sample to air prior to and during weighing.
Volumetric glasswares
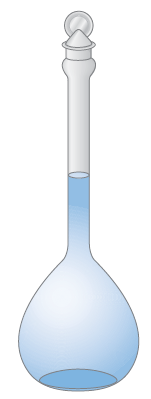
141. What are the examples of volumetric glassware?
VOLUMETRIC FLASKS
PIPETS (Transfer or volumetric pipets and Measuring pipets)

Transfer or volumetric pipets

Measuring pipets.
SYRINGE PIPETS

Hamilton microliter syringe.
BURETS

Titrations and standardization
142. What is titration?
In a titration, the test substance (analyte) reacts with an added reagent of known concentration, generally instantaneously. The reagent of known concentration is referred to as a standard solution.
It is typically delivered from a buret; the solution delivered by the buret is called the titrant. (In some instances, the reverse may also be carried out where a known volume of the standard solution is taken and it is titrated with the analyte of unknown concentration as the titrant.)
143. What is the equivalence point in titration?
The equivalence point is the theoretical end of the titration where the number of equivalents of the analyte exactly equals the number of equivalents of the titrant added. The end point is the observed end of the titration. The difference is the titration error.
144. What is the primary standard?
A standard solution is prepared by dissolving an accurately weighed quantity of a highly pure material called a primary standard and diluting to an accurately known volume in a volumetric flask.
145. What is the secondary standard?
A solution standardized by titrating a primary standard is itself a secondary standard. It will be less accurate than a primary standard solution due to the errors of titrations.
146. Explain the characteristics of the primary standard?
1. It should be 100.00% pure (0.01 to 0.02% impurity is tolerable).
2. It should be stable to drying temperatures, and it should be stable indefinitely at room temperature. The primary standard is always dried before weighing.
3. It should be readily and relatively inexpensively available.
4. If it is to be used in titration, it should possess the properties required for a titration. In particular, the equilibrium of the reaction should be far to the right so that a sharp end point will be obtained.
147. What is the classification of titration methods?
1. Acid–Base
2. Precipitation
3. Complexometric
4. Reduction–Oxidation
5. Non-aqueous titrations
6. Diazotization Titration
148. What is Acid–Base titration?
Both inorganic and organic, are either acids or bases and can be titrated using a standard solution of a strong base or a strong acid. Acid -base titrations are also called as neutralization or aqueous acid -base titrations.
The end points of these titrations are easy to detect, either by means of an indicator or by following the change in pH with a pH meter.
The acidity and basicity of many organic acids and bases can be enhanced by titrating in a nonaqueous solvent. The result is a sharper end point, and weaker acids and bases can be titrated in this manner.
149. Explain different theories of acid-base titrations.
Arrhenius Theory: The first theory was postulated by Arrhenius in 1884 as a part of general theory on electrolytic dissociation. As per this theory, acid is defined “as a substance which generates hydrogen ions when dissolved in water and further these hydrogen ions in association with solvent form hydronium ions’:

Bronsted Theory: Bronsted proposed the new theory in 1923; LOwry also proposed similar theory independently. He defined an acid as ‘a species that can donate protons’ and a base as
‘a species that can accept protons’.

In Bronsted theory, an acid donates proton. It is independent of solvent. This theory differs from Arrhenius theory in their concept of the base.
Lewis Theory: Lewis proposed a theory in 1923, called the Lewis theory. This theory describes an acid as a species which has the capability to accept an electron pair whereas a base is described as a species which has the capability to donate an electron pair. There is no change in the concept of acid-base as every proton acceptor is an electron-pair donor.
This theory is useful to describe the indicator colour change in non-protonic systems exhibiting acid-base reaction.
Law of Mass Action:
The law of mass action was proposed by Goldberg and Wage in 1867. The basics of this law are about the mass of the substances that react in a reaction. The law states that “The rate of a chemical reaction is proportional to the active masses of the reacting substances”.
In dilute solutions where conditions approach the ideal state, ‘active mass’ may be represented by the concentration of the reacting substances, i.e. gm-molecules or gm-ions per litre. The constant of proportionality is known as ‘velocity constant’.
150. What is Strong Acid or Base?
A strong acid is completely dissociated into its component ions in dilute aqueous solution.
Examples:
Strong acids: HCl, HClO4HNO3
Strong bases: NaOH, KOH
151. What is the Buffer solution?
Buffer solution is a solution of substance or a mixture of substances which helps in maintaining and establishing specific pH.
152. What are Neutralization Indicators?
These are the substances used in acid -base titrations that are helpful in detection of end point at the end of reaction. They generally exhibit different colours at the end point at various values of pH. These Indicators exhibit some colour in acidic pH whereas when the pH changes, it produces different colours. So after the neutralization point, they produce colour change as per the pH of the titrant or titrate, and thus denotes the end point. They are weak acids or weak bases, which have different colours in their conjugate base and acid forms. Most indicators are used in dilute solution form.
153. Explain the theories of Acid-Base Indicators?
(A) Ostwald Theory: W. Ostwald postulated the first theory to expla in the behavior of indicators. As per this theory, the undissociated indicator acid or a base has a colour different from its ion.
| Titration between | pH at end point | Commonly used indicators |
| Weak acid and Strong base | Alkaline range | Thymol blue,Phenolphthalein,Thymolphthalein |
| Weak base and Strong acid | Acidic range | Methyl orange,Methyl red,Bromocresol green |
(B) Resonance Theory: This theory explains that the acid-base indicators in use are usually organic compounds. However, they produce different colours in acid and base medium.
| Indicators | pH Range | Acid | Alkaline |
| Methyl orange | 03.1-04.4 | Red | Orange |
| Thymol blue | 01.2-02.8 | Red | Yellow |
| Bromophenol blue | 03.0-04.6 | Yellow | Blue |
| Methyl red | 04.2-06.3 | Red | Yellow |
| Phenolphthalein | 08.3-11.0 | Colourless | Red |
| Phenol red | 06.8-08.4 | Yellow | Red |
| Bromocresol green | 03.8-05.4 | Yellow | Blue |
154. What is Precipitation titration?
In precipitation titration, the titrant generates an insoluble product with the analyte. Indicators can be used to detect the end point, or the potential of the solution can be monitored electrically.
155. What are the different ways through which the separation can be achieved?
There are different ways through which the separation can be achieved which are given below.
1. Precipitation method.
2. Volatilization or evolution method.
3. Electro-analytical method.
4. Miscellaneous physical methods.
156. Explain the principle and steps involved in gravimetry?
Principle:
As already described, the principle involved in gravimetry is the quantitative estimation of component on the basis of measurement of mass. More precisely, the mass of an ion in a pure compound can be determined using gravimetry which is then applied to determine the mass percent of the same ion in a known quantity of a sample or impure compound.
The steps involved in the practice of gravimetry are shown below:
1. Preparation of a solution containing a known weight of the sample.
2. Separation of the desired constituent.
3. Weighing the isolated constituent.
4. Computation of the amount of the particular constituent in the sample from the observed weight of the isolated substance.
Steps Involved in Gravimetry:
The steps involved in practice of Gravimetric analysis are explained below:
1. Sample preparation.
2. Preparation of solution or dissolution.
3. Precipitation.
4. Testing the completeness of precipitation.
5. Digestion or Ageing of precipitate.
6. Filtration.
7. Washing of precipitate.
8. Drying or ignition of precipitate.
9. Weighing.
10. Calculations.
157. What is Complexometric titration?
In complexometric titrations, the titrant is a reagent that generates a water-soluble complex with the analyte (i.e. metal ion). Chelating agent is generally used as titrant.
Ethylenediamine Tetraacetic Acid (EDTA) is one of the most useful chelating agents used for titration. EDTA reacts with a large number of metal ions, and the reaction is controlled by adjustment of pH. Indicators used to detect the end point are forming a highly colored complex with the metal ion.
158. Classify the Complexometric titration?
- Complexometric titrations are classified into the following categories:
- Direct titrations
- Back titrations
- Replacement titrations
- Alkalimetric titration of metals
- Indirect titrations
159. What is Non-aqueous titration?
Non-aqueous titration involves the reaction between acid and base in presence of non-aqueous i.e. organic solvents.
160. Categorize Non-aqueous titration?
The non-aqueous titrations can be categorized mainly in two classes; e.g.
(a) Acidimetry: Some substances behave as base under the condition of titrations, thus determination of basic substances is categorized as acidimetry.
(b) Alkalimetry: Some substances behave as acid under the conditions of titrations, thus determination of acidic substances is categorized as alkalimetry.
161. What is Reduction-Oxidation or redox titration?
In Reduction-Oxidation or redox titration, an oxidizing agent with a reducing agent, or vice versa are used.
An oxidizing agent gains electrons and a reducing agent loses electrons in a reaction between them. Suitable indicators are available to detect the end point or various electrometric means are available to detect the end point.
162. What is Diazotization Titration?
This titration involves the conversion of the primary aromatic amine to a diazonium compound by the reaction with sodium nitrite. In this method, the primary aromatic amine is reacted with the sodium nitrite in acidic medium to form a diazonium salt.
Gas Chromatography (GC)
163. What is Gas Chromatography (GC)?
Gas chromatography is the method of compound separation from a mixture by injecting a liquid or gaseous sample into a mobile phase. The mobile phase is also called the carrier gas. The gas passes through a stationary phase.
In gas chromatography, the sample is converted to the vapor state (if it is not already a gas) by injection into a heated port, and the eluent is a gas (the carrier gas).
The stationary phase is generally a nonvolatile liquid or a liquid-like phase supported on or bonded to a capillary wall or inert solid particles such as diatomaceous earth.
164. What is the characteristic of the mobile phase in Gas Chromatography?
In the gas chromatography, the mobile phase is generally an inert (or unreactive gas). For example, argon, helium, nitrogen or hydrogen.
165. Explain stationary phase of Gas Chromatography?
The stationary phase of Gas chromatography is a microscopic layer of viscous liquid that is layered on the surface of solid particles. The solid particles are further adhered on an inert solid support inside a piece of glass or metal tubing. This is also called the Gas Chromatography column. In some cases, the surface of the solid particles in the CG column act as the stationary phase.
166. Explain the types of Gas Chromatography columns?
There are two types of columns used in Gas Chromatography (GC):
i. Packed columns
ii. Capillary columns
Packed columns came first and were used for many years.
Capillary columns are more commonly used today, but packed columns are still used for applications that do not require high resolution or when increased capacity is needed.
167. Explain the types of Gas Chromatography?
There are two types of GC.
i. Gas–solid (adsorption) chromatography
ii. Gas–liquid (partition) chromatography
168. What Compounds Can Be Determined by GC?
The compound to be determined on GC must be volatile and stable at operational temperatures, typically from 50 to 300◦C.
GC is useful for:
● All gasses
● Most nonionized organic molecules, solid or liquid, containing up to about 25 carbons
● Many organometallic compounds (volatile derivatives of metal ions may be prepared)
If compounds are not volatile or stable, often they can be derivatized to make them amenable to analysis by GC. GC cannot be used for macromolecules nor salts, but these can be determined by HPLC and ion chromatography.
169. What are the types of Gas Chromatography Detectors and its applications?
| Sr. No. | Detector | Application |
| 1. | Thermal conductivity | General, responds to all substances |
| 2. | Catalytic combustion | Very similar to the FID |
| 3. | Flame ionization | All organic substances; some oxygenated products respondpoorly. Good for hydrocarbons |
| 4. | Flame photometric | Sulfur compounds (393 nm), phosphorus compounds (526 nm) |
| 5. | Flame thermionic | All nitrogen- and phosphorus containing substances |
| 6. | Rubidium silicate bead | Specific for nitrogen- and phosphorus-containing substances |
| 7. | Argon ionization (β-ray) | All organic substances; with ultrapure He carrier gas, also for inorganic and permanent gasses |
| 8. | Electron capture | All substances that have affinity to capture electrons; no response for aliphatic and naphthenic hydrocarbons |
| 9. | Vacuum UVabsorption | Nearly all substances but inert gasses and nitrogen |
| 10. | Mass spectrometry | Nearly all substances. Depends on ionization method |
Techniques of pharmaceutical analysis
170. What are the various techniques of pharmaceutical analysis?
The techniques of pharmaceutical analysis can be divided into two major categories.
i. Qualitative analysis
ii. Quantitative analysis
171. What is Qualitative Analysis?
Qualitative Analysis involves various test procedures that are designed for the identification of compounds in the sample. These test results confirm the presence or absence of a compound in the sample to be analyzed.
172. What is Quantitative Analysis?
Quantitative analysis involves the quantitative determination of compounds in the sample. Quantitative analytical techniques are further classified as follows:
i. Chemical Methods: (a) Volumetric, (b) Gravimetric, (c) Gasometric
ii. Physico-chemical Methods or Instrumental Methods
iii. Microbiological Methods
iv. Biological Methods
173. What is the Volumetric Method of Analysis?
In volumetric methods, measurement of volume of solution is taken as a parameter for assay.
The volume of known strength of a solution that is required to react completely with the substance to be analyzed is measured. The quantity of analyte is determined from the volume of solution by calculation. The solution or reagent is called as titrant and the analyte to be analyzed is termed as titrate.
174. What are the types of Volumetric Method of Analysis?
Volumetric methods are classified into different types depending upon the type of reactions involved in the reaction which are as follows:
i. Neutralization titrations
ii. Non-aqueous titrations
iii. Precipitation titrations
iv. Oxid at ion-reduction titrations
v. Complexometric titrations.
175. What is the Gravimetric Method of Analysis?
In Gravimetric analysis, quantitation is done on the basis of weight of compound. This process involves isolation and weighing of the compound of known composition, i,e. purest form.
The analysis is carried out by various processes such as precipitation, volatilization, electro-analytical etc.
176. What is the Gasometrical Method of Analysis?
In Gasometrical method, the measurement of the volume of gases forms the basics of analysis.
When a chemical reaction is carried out under the specific process, the volume of gas evolved or absorbed in the reaction is measured. The measured volume is corrected to standard conditions of temperature and pressure. Gas burettes or nitro-meters are used for the measurement of volume of gas. Example, for gases that are measured by gasometrical methods are carbon dioxide, cyclopropane, oxygen, nitrous oxide, octal nitrate, nitrogen, amyl nitrate, ethylene and helium.
177. What is the Instrumental Method of Analysis?
Instrumental Method of Analysis involves the usage of instruments to measure the physical or physicochemical property of the compound to be analysed thus lead to quantitation of the compound. Following are the examples.
| Physical Properties | Instrumental Methods |
| Electrical potential | Potentiometer |
| Electrical conductance | Conductometry |
| Electrical current | Polarography and voltammetry |
| Absorption of radiation | Spectrophotometry, Colorimetry,Atomic absorption spectroscopy |
| Emission of radiation | Emission spectroscopy,Flame photometry,Fluorimetry |
| Scattering of radiation | Turbidimetric and Nephelometry |
| Refraction of radiation | Refractometry |
| Rotation of plane polarized light | PolarimetryOptical rotatory dispersion |
| Thermal properties | Thermal method of analysis(DSC, DTA, TGA) |
| Mass to charge ratio | Mass spectrometry |
| Separation | Chromatography. |
178. What is the Microbiological Method of Analysis (with example of antibiotic)?
Microbiological Method of Analysis for antibiotics involves the determination of inhibition of growth of bacteria by the substances to be analysed in comparison with the standard compound. On the basis of the result, the therapeutic efficacy of the antibiotics are decided.
The methods which are generally used include the cylinder plate (or cup plate) method and the Turbidimetric (or tube assay) method.
179. What is the Biological Method of Analysis?
Biological assays are carried out to observe the biological effect of the drug on some type of living matter. They are also called as bioassays.
Preparation and standardization of various molar and normal solutions
180. Preparation of N/10 Oxalic Acid.
Oxalic acid (COOH),.2H,O is to be dissolved in one litre of distilled water to get N/10 oxalic acid solution.
Weigh accurately 6.3 g of oxalic acid [(COOH)2 2H2O] and transfer it into a volumetric flask (1 litre), half-filled with distilled water. Shake well and make the volume up to the mark.
Note: If anhydrous oxalic acid (COOH)2 is available, then dissolve 4.5 g of the acid in one litre of distilled water to get 0.1 N oxalic acid solution.
181. Preparation of N/10 NaOH Solution.
Molecular weight of NaOH = 40
Acidity (number of replaceable OH group) = 1
Equivalent weight of NaOH = 40
Therefore, 4 g of NaOH dissolved in one litre of solution will give N/10 NaOH solution.
Procedure:
Weigh accurately 4 g of NaOH in a beaker and dissolve it in distilled water. Weighing should be performed quickly as it is hygroscopic. Transfer the contents and the washings to a 1 litre volumetric flask. Cool and then make the volume up to the mark. Shake well.
Standardization:
The N/10 NaOH prepared as per the above mentioned procedure is standardized by titrating against N/10 oxalic acid using phenolphthalein as an indicator. 10 ml of N/10 oxalic acid is taken in a conical flask to which 2-3 drops of phenolphthalein is added and mixed well. This solution is titrated slowly with constant stirring against N/10 NaOH taken in a burette. Titration is continued till the appearance of permanent pale pink colour as the end point. The volume of approximate N/ 10 NaOH solution at the end point is taken for calculation of normality of NaOH using the following formula.
N1V1 = N2V2
(Base) (Acid)
N1 – Normality of NaOH solution. (?)
V1 – Volume of NaOH solution used. (ml)
N2 – Normality of standard oxalic acid solution. (0.1 N)
V2 – Volume of standard oxalic acid solution. (10 ml)
182. Potassium Permanganate.
Preparation of N/10 KMnO4 Solution:
Molecular weight of KMnO4 = 158 g/mol
Equivalent weight of KMn04 is reaction specific. In acidic medium KMn04 is used as an oxidiser. So there will be 5 electrons gained by the Mn atom. Hence, the equivalent weight of KMn04 = Molecular weight/Number of electrons gained in redox reaction = 158/5 = 31.6. So 3.16 or 3.2 g of KMnO4 is weighed accurately and dissolved in 1 litre of distilled water to get N/10 KMnO4 solution.
In alkaline or neutral medium, reaction of KMnO4 is different and Mn gains 3 electrons in redox reaction. So, for alkaline medium redox titrations, equivalent wt of KMnO4 will be 158/3 = 52.6.
So for 0.1 N KMn04 solution in alkaline medium redox titration, 5.26 g of KMn04 is weighed and dissolved in 1 L distilled water.
Procedure:
In general, 3.2 g of KMn04 is accurately weighed and dissolved in one litre of distilled water. The solution is boiled for 10-15 minutes and then allowed to stand for few days and filtered through glass wool.
Standardization:
10 ml of N/10 oxalic acid is taken in a conical flask. Add 5 ml dilute sulphuric acid, warm it to 60 -70 C and titrate against KMnO4 from the burette till a light pinkish colour appears.
Repeat the titration until concomitant results are obtained. The strength of KMnO4 is calculated using the formula N1V1 = N2V2
Example:
Suppose 10 ml 0.1 N oxalic acid = 8.5 ml of KMnO4
N1V1 = N2V2
0.1 N x 10 = N2 x 8.5
N2 = (10 x 0.1)/8.5=0.1176
To prepare 1000 ml 0.1 N KMnO4, the volume of KMnO4 taken is, (1000 x 8.5 x 0.1)/10 x 0.1 = 850
Now, take 850 ml of prepared KMn04 solution and make it 1000 ml by adding distilled water.
Note: Ordinary or even pure distilled water contains traces of organic matter which reduces the KMnO4 solutions. That is why the solution is boiled and kept for some time before standardization. In the absence of sufficient amount of dilute H2SO4 or due to the rapid addition of KMnO4 in titration flask, brown turbidity (manganous oxide) may appears.
183. Sulphuric Acid.
Preparation of N/10 H2SO4
Equivalent weight of H2SO4 = 49 g
Specific gravity = 1.84 g/ml
So, volume of 49 g H2SO4 = 26.6 ml
Concentrated H2SO4 (reagent grade) is about 97% pure.
Therefore, the actual amount of concentrated H2SO4 required for 1.0 litre of N/10 H2SO4 solution = (100/97) x 26.6 = 27.42 ml.
Thus, for 1.0 litre of N/10 H2SO4 solution, 2.74 ml of concentrated H2SO4 is required.
Procedure:
Take 2.74 ml sulphuric acid in a beaker filled with a small amount of distilled water. Transfer the contents of the beaker to a volumetric flask of 1 litre capacity and make volume up to the mark with distilled water. Shake well.
Standardization:
N/10 H2SO4 is titrated with 10 ml of 0.1 N Na2CO3 using mixed methyl orange as an indicator. Repeat the titration until at least three concordant readings are obtained.
Suppose, 10 ml of 0.1 N Na2CO3 = 9.5 ml of H2SO4
V1N1 = V2N2
10 x 0.1 = 9.5 x N2
N2 = 0.10526
To prepare 1 litre N/10 H2SO4, the volume of 0.10526 N acid required is (1000 x 0.1)/ 0.10526 = 950 ml.
Take 950 ml of 0.10526 N acid and dilute it to one litre. Check it again with N/10 Na2CO2
for three times. It must neutralize an equal volume of N/10 Na2CO3 solution. Label it as 0.1 N H2SO4
184. Hydrochloric Acid.
Preparation of N/10 HCl:
Molar mass for HCI is 36.4611 g/mol. Since HCI has only one hydrogen ion, the equivalent mass will be 36.4611. Specific gravity for 1 litre volume of HCI is 1.189.
For 1 litre volume, Grams of compound needed = (0.1 N)(36.4611)(1 Litre) = 3.6461
Volume of concentrated acid (37.5%) needed =3.6461/(0.375 x 1.189) = 8.1774 ml
So, 8.1774 ml of 37.5% concentrated HCI is dissolved in 1 litre of water to prepare 0.1 N HCI.
Procedure:
Transfer exactly 20 ml of the approximately 0.1 M HCl solution into a 250 ml conical flask.
Add 3 drops of phenolphthalein as an indicator. Titrate against standard N/10 NaOH solution until a permanent pale pink colour appears. Using the volume of NaOH, the strength of HCI is calculated.
Alternatively, HCI can be standardized by titrating with standard N/10 Na2CO3 using methyl orange as indicator. Colour change: yellow to reddish orange
Reaction equation: Na2CO3(aq) + 2 HCI(aq) —–> 2 NaCI(aq) + H2O (l) + CO2(g)
Standardization:
HCI is standardized against standard N/10 NaOH which is already standardized against
N/10 oxalic acid using Phenolphthalein indicator.
HCI + NaOH —-> NaCI + H2O
185. Preparation of 0.1 N Sodium Thiosulphate Solution (Na2S2O3.5H2O).
Dissolve approximately 24.8 gm of sodium thiosulphate crystals in previously boiled and cooled distilled water and make the volume to 1000 ml.
Store the solution in a cool place in a dark colored bottle.
After storing the solution for about two weeks, filter if necessary and standardize as follows:
Standardization:
Weigh accurately about 5.0 gm of finely ground potassium dichromate which has been previously dried to a constant weight at 105 ± 2°C into a clean 1.0 litre volumetric flask. Add sufficient distilled water to dissolve the content of volumetric flask and make up to the mark with distilled water; shake thoroughly and keep the solution in a dark place. Pipette 25.0 ml of this solution into a clean glass stoppered 250 ml conical flask. Add 5.0 ml of concentrated hydrochloric acid and 15.0 ml of 10% potassium iodide solution. Allow to stand in dark for 5 minutes and titrate the mixture with the solution of sodium thiosulphate using starch solution as an indicator towards the end point. The end point is taken when blue color changes to green. Calculate the normality (N) of the sodium thiosulphate using formula.
186. Preparation of 0.1 N Ceric Ammonium Sulphate.
Dissolve 66 gm of eerie ammonium sulphate with gentle heat in a mixture of 30 ml of sulphuric acid and 500 ml of water. Cool the mixture, filter and dilute to 1000 ml with water.
Standardization of 0.1 N Ceric Ammonium Sulphate:
Arsenic trioxide is allowed to dry for an hour. From this, weigh about 0.2 gm of Arsenic trioxide accurately and transfer into a sao ml conical flask. Wash the inner walls of the conical flask with 100 ml of water and mix thoroughly. To this, add 300 ml of dilute sulphuric acid, 0.15 ml of osmic acid and 0.1 ml of ferrous sulfate indicator. Titrate this solution with eerie ammonium sulphate sa luting which was taken in the burette. Continue the titration till the pink colour of the solution changes to pale blue or yellowish green colour. Each ml of 0.1 N ceric ammonium sulphate ~ 0.6326 gm of ceric ammonium sulphate – 4.946 grams of arsenic trioxide.
Errors in pharmaceutical analysis
187. What are the categories of errors that could occur during the analysis?
Two major categories of errors are known as (i) absolute error and (ii) relative errors.
(i) absolute error: The difference between the experimental mean and a true value is known as ‘absolute error’.
(ii) relative errors: The relative error is the value found by dividing the absolute error by the true value.
Relative error = (Measured mean value – True value)/ True value
188. What are the types of error based on its source?
Depending on the nature of errors which affects the accuracy or precision of a measured quantity, it is classified as follows:
i. Determinate Errors: These are ascertainable errors that can be either avoided or corrected. The error may be constant as in the case of weighing with uncalibrated weights or in measuring a volume using burette or pipette. Such measurable determinate errors are categorized as systematic errors.
ii. Indeterminate Errors: Indeterminate errors are often called accidental or random errors. They are revealed by small differences in a series of measurements made by the same analyst under identical conditions.
Determinate Errors are as follows:
Instrumental errors – Faulty equipment or low quality equipment
Personal errors – These errors occur by persons who are handling the method of analysis. The error may be resulted due to carelessness or ignorance and even by unskilled persons. This error is also called operative error.
Chemical errors – These errors are resulted by using chemicals and reagents with impurities or contaminants which may interfere with the reactions, thus affects the results.
Errors in the methodology – This is a most serious error in analysis as the error arises due to faulty method, e.g. co-precipitation of impurities, slight solubility of precipitate, incomplete reactions etc. Errors of this category are usually detectable and can be eliminated to a large extent.
189. How to minimize errors?
Methods to minimize the errors are discussed as follows:
1. Instrumental Errors: Instrumental Errors can be minimized by checking thoroughly the equipment used for the analysis before starting any analysis. Proper calibration should be performed to ensure the performance of equipment. Faulty equipment should be corrected by experts and rechecked for accuracy of results. If the performance is not satisfied then replacement should be done.
2. Personal Errors: Trained persons should perform analysis. Regular reporting and monitoring or analysis can be done.
3. Chemical Errors: Standard chemicals from authentic sources without impurities must be used for the analysis. The quality of chemicals and reagents can be checked periodically as per the standard guidelines.
4. Errors in Methodology: These errors can be avoided by following the standard methods with proper references. Continuous monitoring of reactions by skilled persons can be employed to minimize these errors
5. Indeterminate Errors: Since indeterminate errors are not predictable, the entire procedure of analysis should be carried out in a well -planned manner considering all factors which affect the accuracy and precision of the results.
Significant figures
190. What is a significant figure?
The number of significant figures can be defined as, “the number of digits necessary to express the results of a measurement consistent with the measured precision”.
Or
“the number of digits necessary to express the results of a measurement that is inline with the specification”.
Pharmacopoeia
191. What is Pharmacopoeia?
The word Pharmacopoeia derives from the ancient Greek word pharmakopoiia. Pharmako denotes “drug “; whereas the word (poi-) denotes “make”, thus the term collectively denotes “drug-mak-ing” or “to make a drug”.
A pharmacopoeia, pharmacopeia, or pharmacopoea, is a legally binding collection of standards and quality specifications for medicines used in a country or region. It is prepared by a national or regional authority in that country or region.
192. What is the content available in the Pharmacopoeia?
The pharmacopoeia comprises the recommended procedures for analysis and specifications for the determination of pharmaceutical substances, excipients and dosage forms and thus maintains the quality of medicines.
Most of the pharmacopoeias consist of a general part which includes tests, methods and general requirements for pharmaceutical substances and a specific part which is designed in the form of monographs for pharmaceutical substances.
193. What should be the choice of method between pharmacopoeia or in-house?
Pharmacopoeial method should be method of choice instead of in-house method of analysis.In case pharmacopoeial method does not work it should be justified and scientifically establish the rationale that in-house method is superior then the pharmacopoeial method for the said formulation
194. What should be the frequency of pharmacopoeial method revision?
All pharmacopoeias are needed to be updated constantly due to the continuing scientific progress. The method adopted by an organization also needs to be updated inline with pharmacopoeia as per the given timeline by pharmacoloeia.
195. Who publishes pharmacopoeia?
National level pharmacopoeia refers to pharmacopoeias which are published by the national pharmacopoeial commission of individual countries.
196. What are the pharmacopoeial editions of Indian Pharmacopoeia (IP)?
| Edition | Year | Volumes | Addendum/ Supplement |
| 1st Edition | 1955 | – | Supplement 1960 |
| 2nd Edition | 1966 | – | Supplement 1975 |
| 3rd Edition | 1985 | 2 | Addendum 1989 Addendum 1991 |
| 4th Edition | 1996 | 2 | Addendum 2000 Vet Supplement 2000 Addendum 2002 Addendum 2005 |
| 5th Edition | 2007 | 3 | Addendum 2008 |
| 6th Edition | 2010 | 3 | Addendum 2012 |
| 7th Edition | 2014 | 4 | Addendum 2015 Addendum 2016 |
| 8th Edition | 2018 | 4 | Addendum 2019 Addendum 2021 |
| 9th Edition Effective date is 1st December 2022 (Tentative) | 2022 | – |
Impurities in the pharmaceuticals
197. What are the Sources of Impurities in the pharmaceuticals?
- Raw Material Employed in Manufacture
- Method or the Process used in Manufacture
- Chemical Processes and Plant Materials employed the Process
- Storage Condition
- Decomposition
198. What are the effects of Impurities in pharmaceuticals?
Effects of Impurities in pharmaceuticals are:
1. Impurities which have a toxic effect can be injurious when present above certain limits.
2. Impurities, even when present in traces, may show a cumulative toxic effect after a certain period.
3. Impurities are sometimes harmless, but are present in such a large proportion that the active strength of the substance is lowered. The therapeutic effect of drugs is decreased.
4. Impurities may bring about a change in the physical and chemical properties of the
substance, thus making it medically unfit.
5. Impurities may cause technical difficulties in the formulation and use of the substances.
6. Impurities may bring about an incompatibility with other substances.
7. Impurities may lower the shelf life of the substance.
8. Impurities, though harmless in nature, may bring about changes in odour, colour, taste, etc. thus making the use of the substance unhygienic.
199. How to determine the Permissible Impurities’ limit in Pharmaceutical Substances?
Following points are considered while determining impurity limits.
1. For impurities which are of harmful type such as lead, arsenic etc., a low permissible limit is prescribed. This is based upon, how much of these can be tolerated? Which itself is based upon how much of the impurity is harmful?
2. For impurities that are harmless, the aim is to fix their limits so that their presence does not interfere in the therapeutic usefulness of the drug. Here, again, the limits are prescribed and fixed. This is done depending upon the nature of the impurity, the type of substance, use of the substance etc.
3. Practicability of obtaining substances without impurities at reasonable costs. It may be possible to prepare substances through a series of steps of purification without any impurities, but this could escalate the cost. Considering this aspect, limits of various impurities are fixed.
4. Deliberate adulteration by using materials having similar qualities also accounts for the presence of impurities in the substance, e.g. adulteration of sodium salt with potassium salt, calcium salts with magnesium salts etc. Such adulteration which brings impurities into substances, need not exhibit less therapeutic activity but it is reasonable to expect unadulterated material from an ethical point of view. Pharmacopoeias guard against this type of impurity by employing tests for identification.
200. What are the regulatory requirements for the management of impurity?
Following are the regulatory requirements for the management of impurity

Inspired by: https://www.intechopen.com/
201. Explain the classification of impurities.
Impurities are mainly classified as Organic, Solvents and Inorganic.Details are as follows:

202. What are the general tests for detecting impurities in the pharmaceuticals.
1. Colour, Odour and Taste
2. Physico-chemical Constants
3. Acidity, Alkalinity and pH
4. Anions and Cations
5. Insoluble Residue
6. Ash, Water Insoluble Ash
Limit tests in the pharmaceuticals
203. What are the limit tests in pharmaceuticals?
Limit tests are defined as quantitative or semi-quantitative tests which are performed to identify and control small quantities of impurities which are likely to be present with the substances to be analyzed.
204. Explain the Limit Test for Chloride?
The limit test for chlorides is based upon the chemical reaction between soluble chloride ions with a silver nitrate reagent in a nitric acid media. The insoluble silver chloride renders the test solution turbid (depending upon the amount of silver chloride formed and therefore, on the amount of chloride present in the substance under test.) This turbidity is compared with the standard turbidity produced by the addition of silver nitrate, to the known amount of chloride ion (sodium chloride) solution. If the test solution shows less turbidity than the standard, the sample passes the test.
Dissolve the specified quantity of substance in water or prepare a solution as directed in the pharmacopoeia and transfer to a Nessler’s cylinder A. Add 1 ml of dilute nitric acid except when nitric acid is used in the preparation of the solution. Dilute it to 50 ml with water and add 1 ml of silver nitrate solution, stir immediately with a glass rod and set aside for 5 minutes.
Simultaneously for standard opalescence, place 1 ml of 0.05845 per cent w/v solution of sodium chloride in Nessler’s cylinder B and add 10 ml of dilute nitric acid, make up the volume to 50 ml with water, add 1 ml of silver nitrate solution, stir with the glass rod and set aside for 05 minutes. The opalescence produced by the sample (in cylinder A) should not be greater than standard opalescence.
205. Explain the Limit Test for Sulphate?
In a limit test for sulphate, the solution of the substance under test is mixed with barium sulphate reagent in a hydrochloric acid medium and the turbidity so produced is compared with the standard in similar manner with a known quantity of sulphate ion (using potassium sulphate). The substance passes the limit test if it produces a turbidity that is less than the standard.
A solution of specified quantity of substance is made in water or prepared as directed in the pharmacopoeia in Nessler’s cylinder; add 2 ml dilute hydrochloric acid except where hydrochloric acid is used in the preparation of solution. Dilute it to 45 ml with water, add 5 ml of barium sulphate reagent, stir immediately with the glass rod and set aside for 5 minutes. To produce standard turbidity, place 1 ml of 0.1089 percent w/v solution of potassium sulphate and 2 ml of dilute hydrochloric acid in another Nessler’s cylinder, dilute to 45 ml with water, add 15 ml of barium sulphate reagent, stir immediately and set aside for 5 minutes. The turbidity produced by the sample solution is not greater than the standard turbidity.
British Pharmacopoeia makes use of a barium sulphate reagent, which contains barium chloride, alcohol and small amounts of potassium sulphate. Alcohol prevents super-sa turation, and potassium sulphate increases the sensitivity of the test by giving the ionic concentration in the reagent, which just exceeds the solubility product of barium sulphate.
206. Explain the Limit Test for Iron?
This test is based upon the reaction of iron in an ammoniacal solution, with thioglycollic acid which forms a pink to deep reddish purple coloured complex of iron -thioglycoliate. The colour produced from a specified amount of substance from the test, is compared by viewing vertically, with a standard (Ferritic ammonium sulphate). If the colour from test solution is less dark than the standard then the sample passes the test.
The Fe (SCH2 COOH)2 formed with the ferrous form of iron, is quite stable for long period in the absence of air. The colour, however, is destroyed by oxidizing agents and strong alkali s. The original state of iron is unimportant, as thioglycollic acid reduces Fe3+ to Fe2+.
This test is very sensitive. Interference of other metal cations is eliminated, by making use of 20 percent citric acid, which forms complex with other metal cations.
Prepare a solution by dissolving a specified amount of substance in 40 ml water or take 10 ml of solution as directed in the monograph in Nessler’s cylinder. Add 2 ml of 20 per cent w/v solution of iron free citric acid and 0.1 ml thioglycollic acid, mix and make alkaline with iron free ammonia solution and dilute it to 50 ml with water. Allow to stand for 5 minutes. For standard, imultaneously dilute 2 ml of standard iron solution with 40 ml of water, add the same quantity of reagent as in the sample. Any colour produced by the sample is not more intense than the standard.
Earlier, ammonium thiocyanate reagent was used for the limit test of iron. Since thioglycollic acid is more sensitive reagent for iron, it has replaced ammonium thiocyanate in the test.
207. Explain the Limit Test for Heavy Metals?
The Indian Pharmacopoeia adopts three methods for the limit tests for heavy metals. The ‘Method A’ is used for the substance which yields a clear colourless solution under specified conditions. ‘Method 8’ is used for those substances which do not yield clear colourless solution under the test conditions specified for method A. ‘Method C is used for substances that yield clear colourless solution in sodium hydroxide medium. The reagents like acetic acid, ammonia, hydrochloric acid, nitric acid, potassium cyanide and sulphuric acid should be lead free and designated as ‘Specific reagents ‘.
Method A:
Standard solution is prepared by taking 2 ml of standard lead solution and by diluting it to 25 ml with water. The pH is adjusted between 3 and 4 by using either dilute acetic acid or dilute ammonia solution. Make up the volume of 35 ml with water.
Test solution is prepared as directed in the individual monograph. Take 25 ml and adjust the pH of the solution between 3.0 and 4.0 by using dilute acetic acid or dilute ammonia and adjust the volume to 35 ml with water.
To each of the cylinders containing standard and test solution, add 10 ml of freshly prepared hydrogen sulphide solution, mix, dilute to 50 ml with water and allow it to stand for 5 minutes. The colour when viewed downwards over white surface shou ld not be darker for the test than the standard solution.
Method B:
The standard solution is prepared as directed under method A. Test solution is prepared in a crucible by weighing a specified quantity of substance as per monograph. Moisten the substance with sulphuric acid, ignite on a low flame till completely charred. Add few drops of nitric acid and heat to SOOT Allow to cool, add 1 ml of hydrochloric acid and evaporate to dryness. Moisten the residue with 10 ml hydrochloric acid and digest for two minutes.
Neutralize with ammonia solution and make just acidic with acetic acid. Adjust the pH between 3.0 and 4.0, filter if necessary. Adjust the volume of filtrate to 35 ml in Nessler’s cylinder, add 10 ml of hydrogen sulphide solution, dilute to 50 ml with water and compare the colour with standard solution.
Method C:
The standard solution is prepared by using 2 ml of standard lead solution; adding 5 ml dilute sodium hydroxide solution and making the volume to 50 ml with water. For the test solution, take either 25 ml solution prepared as directed in the monograph or dissolve specified quantity of substance in 20 ml water, add 5 ml of dilute sodium hydroxide solution and make up the volume to 50 ml.
To each of the above solution in Nessler’s cylinder add 5 drops of sodium sulphide solution, mix and set aside for 05 minutes. The colour produced by test solution should not be darker than the standard solution.
208. Explain the Limit Test for Volatile Oils?
In 25 ml glass stoppered test tubes; 10 ml of the oil is mixed with an equal volume of water containing a drop of hydrochloric acid. Hydrogen sulphide is passed through the mixture until it is saturated. No darkening in colour should be produced neither in the oil, nor in the water layer, for the sample to pass the test.
209. Explain the Limit Test for Lead?
The limit test for lead as per IP and USP is based upon the reaction between lead and diphenylthiocarbozone (dithizone). Dithizone in chloroform extracts lead from alkaline aqueous solutions as a lead Dithizone complex (red in colour).
The original dithizone has a green colour in chloroform thus the lead-dithizone shows a violet colour. The intensity of the colour of the complex depends upon the amount of lead in the solution. The colour of the lead-dithizone complex in chloroform is compared with a standard volume of lead solution, treated in the same manner.
In this method, the lead present as an impurity in the substances, is separated by extracting an alkaline solution with a dithizone extraction solution. The interference and influence of other metal ions etc. is eliminated by adjusting the optimum pH for the extraction, by using ammonium citrate, potassium cyanide, hydroxylamine hydrochloride reagents etc.
Method:
A known quantity of the sample solution is taken in separating funnel: 6 ml of ammonium citrate, and 2 ml of hydroxylamine hydrochloride is added, followed by 2 drops of phenol red, and the solution is made alkaline by adding an ammonia solution. Add 2 ml of potassium cyanide solution and extract immediately with 5 ml portions of dithizone solution (till green). The combined dithizone extracts are shaken for 30 seconds, with 30 ml of 1 percent nitric acid, and the chloroform layer discarded. To the acid solution 5 ml standard dithizone solution is added along with 4 ml of ammonium cyanide and shaken for 30 seconds. A known quantity of the standard solution of lead (equivalent to the amount of lead permitted in the sample) is treated separately. The violet colour of the chloroform layer- of the sample- should not be darker than the standard for the sample to pass the test.
In the preparation, an appropriate preliminary treatment is given to get lead in the solution, without any interfering substance or ion. All reagents employed under the test (except for standard lead solution), should be free from lead, and are designated as ‘PbT’ reagents in pharmacopoeias.
Limit Test for Lead as per British Pharmacopeia:
British Pharmacopeia adopts another method for the limit test for lead which is based on the formation of a brownish colouration produced by the colloidal lead sulphide upon addition of sodium sulphide to the solution under test. If the lead content is more, then a brownish black precipitate of lead sulphide is obtained. The colour produced in the test solution is matched against the standard that is made from a known amount of lead in a Nessler’s cylinder. In order to carry out this test two solutions, a primary and an auxiliary are prepared from the sample.
Method:
Two solutions of the substance under test are prepared with hot water and acetic acid. One is the primary solution containing a definite but greater amount of substance and placed in a 50 ml Nessler’s cylinder. The other is the auxiliary solution containing a known amount of the test substance in another 50 ml Nessler’s cylinder. To this auxiliary solution, a definite amount of a dilute solution of lead nitrate is added. Ammonia and potassium cyanide solutions are added to both the solutions in the Nessler’s cylinders. Small amounts of burnt sugar solution are added to both solutions; to correct any difference of colour and the volume is made up to 50 ml. If the solutions appear turbid, they are filtered and the volume made up to SO ml. Both solutions are treated with sodium sulphide solution and a colour is developed. If the colour in the auxiliary solution is darker than that in the primary, the substance contains lead within limits.
The object of using primary and auxiliary solutions of substances is to have a comparison made under identical conditions. Interference by any unknown entity present in the solution is eliminated by this technique.
210. Explain the Limit Test for Arsenic?
Arsenic is an undesirable and harmful impurity in medicinal substances, and all pharmacopoeias prescribe a limit test for it. There are many qualitative and quantitative tests for arsenic. The pharmacopoeial method is based on the Gutzeit test. In this test, arsenic is converted into arsine gas, (AsH3) which when passed over a mercuric chloride test paper, produces a yellow stain. The intensity of the stain is proportional to the amount of arsenic present. A standard stain produced from a definite amount of arsenic is used for comparison.
The chemical reactions involved in the method are given below:
When the sample is dissolved in acid, the arsenic present in the sample is converted to arsenic acid. The arsenic acid is reduced by reducing agents like potassium iodide, stannous chloride etc. to arsenious acid.
The nascent hydrogen produced during the reaction, further reduces arsenious acid to arsine (gas), which reacts with mercuric chloride paper, producing a yellow stain.
To carry out the test, a specified apparatus (as described in pharmacopoeias) is used. In order to convert arsenic into arsine gas, various reducing agents like zinc and hydrochloric acid, stannous chloride and potassium iodide are employed. The rate of evolution of gas is maintained by using a particular size of zinc, and controlling the concentration of acids and
other salts of the reaction medium, besides temperature. Any impurity coming along with the gas (like H,S) is trapped by placing a lead acetate soaked cotton plug in the apparatus. All the reagents employed for the test should be arsenic-free, and are designated as AsT in pharmacopoeias.
Electrochemical methods of analysis in the pharmaceuticals
211. Which are the electrochemical methods of analysis?
• Conductometry
• Potentiemetry
• Polarography
212. What is Conductometry analysis?
Conductometry involves determination of conductance of an electrolyte solution using a conductometer. When solutions of electrolytes are subjected to an electric field, they conduct electric current by migration of ions. This process of conductance obey Ohm’s law.
Conductance is expressed as the reciprocal of resistance i.e. 1/R and it is denoted by unit
known as mhos or ohms-I.
There are different types of conductance as follows:
1. Specific conductance
2. Equivalent conductance
3. Molar conductance
213. What are the applications of conductometry analysis?
- Conductivity meter
- Conductometric Titrations
- Strong acid with strong base
- Strong acid with weak base
- Weak acid with strong base
- Weak acid with weak base
- Very weak acid with strong base
- Mixture of hydrochloric acid (strong acid) and acetic acid (weak acid) with strong base
- Displacement titrations
- Precipitation and complex formation titrations
- Redox titrations
- Determination of solubility of sparingly soluble material
- Kinetic studies
- Degree of dissociation of weaker electrolytes
- Basicity of organic acids
- Determination of concentration:
214. What is potentiometry analysis?
Different electrode systems are used in combination to measure potential or pH (hydrogen ion concentration) of a solution. A pair of electrode is commonly required in measurement. One electrode acts as an indicator electrode, while the other as reference electrode.
215. Example of potentiometry reference electrodes, its advantages and disadvantages?
A. Normal Hydrogen Electrode (NHE)
- Advantages of Hydrogen Electrode (NHE)
- It is a fundamental electrode and is used as a standard in pH measurements.
- It can be used over a wide pH range.
- It exhibits no salt error.
- It establishes equilibrium rapidly and gives accurate results.
- Disadvantages of Hydrogen Electrode
- It can not be used in solutions containing strong oxidizing or reducing agents.
- It can not be used in solutions containing metal ions that are below hydrogen in
- potential series (In such cases interaction with hydrogen will occur and the metal
- will be deposited on the electrode surface).
- It gets readily poisoned by a number of substances like proteins, tannins, mercury salts etc.
- It is cumbrous to prepare, and use in routine analysis.
B. Calomel electrode
- Bell jar type
- Side arm test-tube type
- Test-tube type
- Advantages of Calomel Electrode are:
- It is sturdy and useful for measurement of a wide pH range.
- It can be employed in various solvents.
- Disadvantages of Calomel Electrode are:
- It is unstable at higher (above 80°) temperature and
- It is unsuitable where chloride ions show incompatibility.
C. Silver/ Silver Chloride Electrode
D. Mercury-Mercurous Sulphate Electrode
216. Example of indicator electrodes, its advantages and disadvantages?
1. Hydrogen electrode
2. Quinhydrone electrode
- The advantage of this electrode is that it attains equilibrium rapidly and can be used where the hydrogen electrode is unsuitable. It gives accurate results also.
- Disadvantage of this electrode is that it can not be used in more alkaline solutions whose pH is above 8 as it readily gets oxidized by air in alkaline medium.
3. Antimony electrode
Advantages of antimony electrode include:
- It can be used for measuring pH ranging from 2 to 8.
- It can be used in viscous or turbid solvents.
- It is sturdy and therefore, it is very useful where continuous pH recordings are made.
- The electrode does not get readily poisoned.
The disadvantages of antimony electrode are:
- It can not be used in measuring pH below 03 as the oxide gets dissolved.
- It can not be used in presence of strong oxidizing agents and complexing agents.
- It can not be used in presence of metals such as Cu, Ag, Au which are more noble than antimony (i.e. below in electromotive series).
- It suffers from salt error. A modified micro antimony electrode is currently used in industry.
4. Glass electrode
Advantages of glass electrode:
- It exhibits reasonably rapid response over a wide range of pH.
- It is uninfluenced by the presence of oxidizing or reducing agents.
- It can be used in viscous, coloured solutions, suspensions of colloidal solutions.
Disadvantages of glass electrode:
- It is fragile and hence should be handled carefully – minute scratches render the electrode useless.
- It is unsatisfactory in more alkaline, above pH 10 range, as there is a partial exchange of other cations than hydrogen ion through membrane.
Karl fischer method for determination of water
217. What is the purpose of the Karl fischer method of analysis?
The method of analysis proposed by Karl Fischer (in 1935) is considered as relatively specific for water. It essentially makes use of the Karl Fischer reagent which is composed of iodine, sulphur dioxide, pyridine and methanol. Pyridine and methanol used during the method of analysis should be anhydrous.
218. Explain the theory of the Karl fischer method of analysis?
Water present in the analyte reacts with the Karl Fischer reagent as per following two-stage process:
Stage 1:

Stage 2:

Oxidation of sulphur dioxide takes place by iodine to yield sulphur trioxide and hydrogen iodide thereby consuming one mole of water. Each one molecule of iodine disappears against each molecule of water present in the given sample. It is pertinent to mention here that in the presence of a large excess of pyridine (C5H5N), all reactants as well as the resulting products of reaction mostly exist as complexes as evident from above equations.
219. Explain the precautions while using the Karl Fischer reagent.
- Always prepare the reagent a day or two before it is to be used,
- Great care must be taken to prevent and check any possible contamination either of the reagent or the sample by atmospheric moisture,
- All glassware(s) must be thoroughly dried before use,
- Standard solution should be stored out of contact with air, and
- Essential to minimize contact between the atmosphere and the solution during the course of titration.
Optical method of analysis
220. What are the examples of optical methods of analysis?
- Refractometry
- Polarimetry
- Nephelometry
- Turbidimetry
221. What is the Refractometry method of analysis?
Light passes more rapidly through a vacuum than through a substance (medium). It has been observed that when a ray of light happens to pass from one medium (a) into another medium (b) it is subjected to refraction. The ray travels at a lower velocity in the relatively more optically dense medium (b) than in medium (a) which is less optically dense.

Diagram represents the Path of Light between Two Media ‘a’ and ‘b’
222. What are the various applications of refractivity?
(a) Determine the molar refractivity of different substances and comparing their values with theoretical ones
(b) Molar refractivity is an additive property, hence, it may be utilized to determine the refractivities of homogeneous mixtures (as solutions).
(c) Determination of Critical Micelle Concentration.
223. What is the polarimetry method of analysis?
An optically active substance is one that rotates the plane of polarized light. In other words, when a polarized light, oscillating in a specific plane, is made to pass through an optically active substance, it happens to emerge oscillating in an altogether different plane.
224. Explain the principle of a polarimeter.
Principle of a polarimeter is that light from the source, usually a sodium vapour lamp, first gets collimated at A, and subsequently falls upon polarizer B (a calcite prism). The polarizer
permits only the light polarized in a particular direction to pass it. The emergent polarized ray now passes through the sample under investigation, kept in the polarimeter glass tube C to the analyzer D, which happens to be another polarizing prism. The analyzing rotator prism D (Nicol) is fixed in such a manner that it can be rotated easily about the axis of the incident light ray. Two situations arise when the analyzing rotator prism (D) is put into action, firstly, the prism being parallel to the plane of polarization of the incident light—the net result is that the intensity of light reaching the Null detector F is maximum ; and secondly, the prism being perpendicular
to the plane of the polarized light—the net result is observed by the intensity of light reaching the detector as minimum. Hence, the overall difference in the position of the analyzer, as noted from the circular scale E, that provides minimum light intensity with and without the sample in the cell is the observed ‘rotation’ of the sample in question.

A = Collimated monochromatic light source,
B = Polarizing prism (Nicol),
C = Polarimeter glass tube (20 cm) with glass windows,
D = Analyzing rotator prism (Nicol),
E = Circular scale with vernier,
F = Null detector (Eye or Photoelectric Cell).
225. Explain Specific Rotation.
A polarized light when passed through an optically active substance, each molecule of it encountered by the light beam rotates the plane of polarization by a constant amount characteristic of the substance. Consequently, a measure of the rotary power of the individual molecule, irrespective of the two parameters, namely : the path length and the concentration, is achieved by converting the measured rotation into a specific rotation.
226. Explain Turbidimetry.
When light is passed through moderately stable suspensions, a portion of the incident radiant energy is dissipated by virtue of the absorption, refraction, and reflection, whereas the remaining portion gets transmitted. It is quite evident that the optical characteristics of each suspension shall alter according to the concentration of the dispersed phase. The measurement of the intensity of the transmitted light through such suspensions vis-a-vis the concentration of the dispersed phase serves as the basis of turbidimetric analysis.
In short, turbidimetry is the measurement of the degree of attenuation of a radiant beam incident on particles suspended in a medium, the measurement being made in the directly transmitted beam.
227. Explain Nephelometry.
When light is passed through moderately stable suspensions, and it is viewed at 90° (i.e., right angles) to the direction of the incident light the system appears opalescent on account of the reflection of light from the particle of the suspension. This scattering of light is termed as the Tyndall effect.
The observed opalescence or cloudiness is the net result caused by irregularly and diffusely reflected light from the suspension. Consequently, the ultimate measurement of the intensity of the scattered light as a true representation of the actual concentration of the dispersed phase forms the basis of nephelometric analysis (derived from Greek : nephele-means cloud).
It is found to be most sensitive and effective specially in the case of very dilute suspensions having a concentration not greater than 100 mg L–1. However, it is interesting to observe that the technique of turbidimetric analysis resembles that of flame photometry ; and nephelometric analysis to that of fluorimetry.
Nephelometry exclusively refers to the measurement of the light scattered by suspended particles at right angles (perpendicular) to the incident beam.
Nuclear Magnetic Resonance (NMR) spectroscopy
228. Explain the Nuclear Magnetic Resonance (NMR) spectroscopy.
In Nuclear Magnetic Resonance (NMR) spectroscopy, energy from an external source is absorbed and brings about a change or resonance to an ‘excited’ or high energy state.
The energy required for NMR lies in the low energy or long wavelength radio-frequency end of the electromagnetic spectrum. Because of the magnetic properties of nuclei arising from the axial spin, the emerging radiofrequency gets absorbed in a magnetic field.
Because of this, for a particular nucleus an NMR absorption spectrum invariably comprises one to several groups of absorption lines in the ratio-frequency portion of the electromagnetic spectrum.
Hence, the location of peaks indicate the chemical nature of the nucleus, whereas the multiplets provide information regarding the spatial positions of the neighbouring nuclei. For this reason the NMR is also known as Nuclear Spin Resonance (NSR) spectroscopy.
Therefore, NMR spectroscopy finds its applications for compound identification, by means of a ‘fingerprint technique’ very much identical to that used in IR-spectroscopy. Besides, it is invariably utilized as a specific method of assay for the individual constituents of a mixture. A few typical examples of drug assays will be dealt separately at the end of this chapter to justify its efficacy and usefulness.
229. Explain the NMR phenomenon.
A. The Spinning Nucleus : The nucleus of the hydrogen atom, i.e., the proton, just behaves as if it is a small spinning bar magnet. It does so because it evidently possesses an electrical charge as well as a mechanical spin. Consequently, a spinning charged body will generate a magnetic field, and hence the nucleus of hydrogen atom is not an exception
B. The effect of an External Magnetic Field : As a ‘compass needle’ possesses an inherent tendency to align itself with the earth’s magnetic field, the proton not only responds to the influence of an external magnetic field but also tends to align itself with that field. However, because of restrictions as applicable to nuclei (not to compass needles) the proton can only adopt the following two orientations with regard to an external magnetic field.
(a) when proton is aligned with the field (i.e., at lower energy state),
(b) when proton is opposed to the field (i.e., at higher energy state).
C. The Precessional Motion: The proton appears to be behaving as ‘spinning magnet’ and therefore, not only can it align itself with or oppose an external field, but also may move in a characteristic manner under the influence of the external magnet.
D. The Precessional Frequency: The spinning frequency of the nucleus does not change at all, whereas the speed of precession does. Therefore the precessional frequency is directly proportional to the strength of the external field. It designates one of the most important relationships in NMR-spectroscopy.
E. The Energy Transitions: Whenever a proton is precessing in the aligned orientation (low energy) it can absorb energy and pass into the orientation (high energy); and subsequently it can lose this extra energy and relax back into the aligned state.
230. What information is provided by 1H-NMR (PROTON-NMR)?
1H-NMR provides many valuable information that are used for the structural elucidation as well as assay of important pharmaceutical substances. Details are as follows:
(i) To record differences in the magnetic properties of the various nuclei present,
(ii) To deduce in large measure the exact locations of these nuclei within the molecule,
(iii) To deduce how many different types of hydrogen environments are present in the molecule,
(iv) To deduce which hydrogen atoms are present on neighbouring carbon atoms, and
(v) To measure exactly how many H-atoms are actually present in each of these environments.
231. Explain 3H-NMR (TRITIUM NMR-SPECTROSCOPY).
The ease with which ‘tritium’ could be employed for labelling organic compounds, having fairly high molar specific activity, has turned it into a very useful and versatile β-emitting radionuclide for chemical and life sciences research.
The unique novel characteristic feature of tritium tracers being that it may be used as a tracer for carbon as well as hydrogen structures.
232. Advantages of 3H-NMR (TRITIUM NMR-SPECTROSCOPY).
• A rapid direct and non-destructive method,
• Provides direct information on regiospecificity,
• Gives quantitative distribution of the label,
• Caters for accurate and precise information on the stereochemistry of the label, and
• Requires only millicuries rather than microcuries or lesser amounts of radioactivity.
233. Explain 13C-NMR SPECTROSCOPY.
The ‘carbon-skeleton’ has been viewed directly with the help of Carbon-13 NMR spectroscopy on a particle basis since the early 1970’s; whereas 1H-NMR spectrometry started in the late 1950’s. The valuable contribution made by various researchers, between 1976 and 1980, has virtually placed 13C-NMR to a strategically much advanced stage where it gives a clear edge over 1H-NMR in terms of not only its versatility but also its wide application in analysis.
13C-NMR refers to recording another NMR-spectrum but of the C-13 atoms rather than the hydrogen atoms. In actual practice, however, -‘these spectra are recorded in such a manner that each chemically distinct carbon gives rise to single peak, without any coupling or fine structure’.
Hence, simply a count of the peaks can be used to see how many carbons are actually present in the molecule. But this particular technique is not reliable for a molecule that exhibits symmetry, because this would ultimately reduce the number of peaks.
234. Explain 2D-NMR (TWO DIMENSIONAL CORRELATION SPECTROSCOPY OR TWO DIMENSIONAL COSY SPECTRUM)
The interaction between different hydrogens in a molecule, known as ‘scaler’ or ‘spin-spin coupling’, transmitted invariably through chemical bonds, usually cover 2 or 3 at the most. Therefore, when a hydrogen with a chemical shift ‘A’ is coupled to a hydrogen with chemical shift ‘B’, one would immediately make out that the hydrogens must be only 2 or 3 bonds away from one another. To know exactly with particular hydrogens are coupled to one another it is necessary to record a two-dimensional ‘Correlation Spectroscopy’ (COSY) spectrum.
Generally, a normal NMR-spectrum has amplitude plotted Vs just one frequency-dimension (the ppm scale). In 2D-NMR, the amplitude is plotted Vs two frequency-dimensions (two ppm scales), normally in the form of a counter plot, just like a topographic map.
The most important aspect about these 2D-NMR spectra is that they show the relation between the peaks in an NMR-spectrum.
235. Applications of NMR-spectroscopy in pharmaceutical analysis
a. Identification testing
b. Assay of drugs
Emission spectroscopy
236. Explain Emission spectroscopy.
In emission spectroscopy, the atoms present in a sample undergo excitation due to the absorption of either electrical or thermal energy. Subsequently, the radiation emitted by atoms in an excited sample is studied in an elaborated manner both qualitatively and quantitatively.
237. Use of emission spectroscopy.
Emission spectroscopy is useful analytical tool for the analysis of :
- Elemental analysis of metals,
- Identification and quantitative determination of metallic elements,
- Estimation of metalloids e.g., arsenic, silicon, selenium, present is extremely low concentrations,
- Analysis of solids, liquids or gases as follows :
- solids-as such or evaporated solutions,
- liquids-atomized spray, analyzed occasionally, and
- gases-analyzed rarely.
238. Explain the theory of emission spectroscopy.
Emission spectroscopy can be explained using following aspects:
(a) Spectra: A beam of light on being passed either through a Nicol’s prism or a grating, is split-up right into its constituent array of colours frequently termed as spectrum. However, the complete spectrum has a wide range that may be further divided into various regions based on their respective wavelengths (0 to 35,000° A), i.e Ultraviolet Region, Visible Region, and Infrared Region.
(b) Classes of Spectra: There exist, in fact, two major types of spectra commonly termed as emission spectra and the absorption spectra.
(c) Classification of Emission Spectra: The emission spectra may be classified into the following three types, namely, i. Band Spectra (or Molecular Spectrum), ii. Continuous Spectra, and iii. Line Spectra Effect of Concentration on Line and Band Spectra : The radiant power by virtue of the radiant energy, of a line or band exclusively depends directly on the total number of excited atoms or molecules present, which is subsequently proportional to the total concentration of the species present in the source.
(d) Effect of Concentration on Line and Band Spectra: The radiant power by virtue of the radiant energy, of a line or band exclusively depends directly on the total number of excited atoms or molecules present, which is subsequently proportional to the total concentration of the species present in the source.
(e) Excitation-Energy Requirements: A single spectral-line is emitted from an element only when the energy equivalent to the excitation potential of the element is usually absorbed. This particular requirement is very critical and important. Exactly in a similar manner, the full-fledged complete spectrum is obtained possibly only when the energy equivalent to the ionization potential is absorbed by a molecule.
239. Explain the Salient Features of Excitation Sources.
Salient Features of Excitation Sources are follows:
• Sample should be changed into its vaporized form,
• Vaporized form of sample must be dissociated into atoms,
• Electrons present in the atoms should be excited from the ground state to higher-energy levels,
• Capable of exciting atoms of most of the elements of interest (in the Periodic Table),
• To produce sufficient line-intensity in order to detect these lines within the scope of the ‘detection limit’, and
• Must essentially achieve reproducible excitation conditions of various samples.
240. Explain the types of Excitation Sources.
(i) Flames
(ii) Direct Current Arc
(iii) Alternating Current Arc
241. Explain the types of electrodes.
(a) Self Electrodes
(b) Graphite Electrodes
242. Explain the process of sample handling in emission spectroscopy.
(a) Solids: Solid samples can also be sub-divided into two categories, such as : (i) Those possessing good conductance characteristics and can withstand high temperatures : it can be achieved by making electrodes with the material directly to be used for the electrical discharge ; (ii) Those having poor conductance and cannot withstand high temperatures : it can be powdered mixed with the powdered graphite (known as buffer) and placed in the depression of the lower graphite electrode. On passing the electrical discharge the material (sample) is first vaporised into the body of the discharge and subsequently the spectrographic emission occurs.
(b) Liquids: Liquid samples may be dispensed conveniently with the aid of two types of smallholders, namely : firstly, wherein the porous base of the cup gradually releases the sample into the discharge from the top ; and secondly, wherein the rotating-disc carriers take up the sample into the discharge from the bottom steadily.
243. Which monochromators are used in emission spectroscopy?
(a) Prism Monochromators
(b) Grating Monochromators
244. Which Detectors are used in emission spectroscopy?
(a) Photographic Detectors-used for qualitative analysis,
(b) Photomultiplier Detectors-used for quantitative analysis
245. Explain the applications of emission spectroscopy.
1. Emission spectroscopy is used for the analysis of various alloys, namely : aluminium, copper, magnesium, zinc, lead, and tin.
2. It is used for the analysis of a number of elements, for instance : Na, K, Zn, Cu, Ca, Mg, Ni and Fe present in various tissues of human beings. Changes in trace-metal concentrations can be studied at length with regard to the ageing process.
3. Trace amounts of Ca, Cu, and Zn can be examined in blood samples.
4. Presence of Zn can be examined in the pancreas tissue.
5. To determine the extent of elements present in ‘crude oil’ by virtue of the fact that some of these may poison the catalysts used in the cracking-process e.g., V, Cu, Ni, and Fe.
Flame Emission Spectroscopy (FES)
246. What is Flame Emission Spectroscopy (FES)?
Metallic salts or metallic compounds after dissolution in appropriate solvents when introduced into a flame (for instance : acetylene burning in oxygen at 3200°C), turns into its vapours that essentially contain mostly the atoms of the metal.
Such gaseous metal atoms are raised to a particular high energy level that enables them to allow the emission of radiation characteristics features of the metal. (Example: the characteristic flame colourations of metals frequently encountered in simple organic compounds such as : Na-yellow, Ca-brick-red ; Ba-apple-green) This forms the fundamental basis of initially called Flame Photometry, but more recently known as Flame Emission Spectroscopy (FES).
It is evident that a relatively large proportion of the gaseous metal atoms shall remain in the ground state i.e., in an unexcited form. It has been observed that such ground-state atoms shall absorb radiant energy pertaining to their own particular resource wavelength. Therefore, when a light having the same resonance wavelength is made to pass through a flame consisting of such atoms, a portion of the light shall be absorbed accordingly.
The extent or degree of absorption would be directly proportional to the total number of ground-state present in the flame.
247. Explain the steps of Flame Emission Spectroscopy (FES) and Atomic Absorption Spectroscopy (AAS)
The emission spectrum obtained is made up of a number of lines that actually originate from the resulting excited atoms or ions ; and these steps are explained as follows.
Step-1: The liquid sample containing a suitable compound of the metal (M+ A–) is aspirated into a flame, thereby converting it into its vapours or liquid droplets,
Step-2: The evaporation of vapours (or droplets) give rise to the corresponding solid residue,
Step-3: The vapourization of the solid residue into its gaseous state occurs,
Step-4: The dissociation of the gaseous state into its constituent atoms, namely : M(gas)+ A(gas) take place, that initially, is in ground state,
Step-5: The thermal excitation of some atoms into their respective higher energy levels will lead ultimately to a condition whereby they radiate energy (flame emission) measured by Flame Emission Spectroscopy (FES), and
Step-6: The absorption of radiant energy by some atoms into their higher energy levels enable them to radiate energy (atomic absorption) measured by Atomic Absorption Spectroscopy (AAS).
248. What is the principle of Flame Emission Spectroscopy (FES)?
The principle of Flame Emission Spectroscopy (FES) can be explained when a liquid sample containing a metallic salt solution under investigation is introduced into a flame, the following steps normally takes place in quick succession, namely :
(i) the solvent gets evaporated leaving behind the corresponding solid salt,
(ii) the solid salt undergoes vaporization and gets converted into its respective gaseous state,
(iii) the progressive dissociation of either a portion or all of the gaseous molecules gives rise to free neutral atoms or radicals.
The resulting neutral atoms are excited by the thermal energy of the flame which are fairly unstable, and hence instantly emit photons and eventually return to the ground state (i.e., the lower energy state). The resulting emission spectrum caused by the emitted photons and its subsequent measurement forms the fundamental basis of FES.
249. Explain Types of Flame Photometers.
There are two types of Flame Photometers that are used invariably in Flame Emission Spectroscopy (FES) which are as follows :
(a) Simple Flame Photometer
(b) Internal Standard Flame Photometer
250. Explain the applications of flame emission spectroscopy in pharmaceutical analysis.
i. Assay of sodium, potassium and calcium in blood serum and water
ii. Assay of barium, potassium and sodium in calcium acetate
ii. Cognate assays
Atomic Absorption Spectrophotometer
251. Explain Atomic Absorption Spectrophotometer.
In atomic absorption spectroscopy (AAS) the sample solution is aspirated directly into a flame or by using an electrothermal device-whereby the sample solution is first evaporated and then ignited on a hot surface. It has been noticed that gaseous metal atoms in an unexcited form i.e., ground state atoms, will absorb radiant energy related to their own specific resonance wavelength. Hence, when a light with the same resonance wavelength is passed through a flame comprising of such atoms, a part of the light will be absorbed accordingly. Besides, the degree of absorption would be directly proportional to the total number of ground-state atoms present in the flame, which ultimately forms the basis of Atomic Absorption Spectroscopy (AAS).
252. Explain the theory/ principle of Atomic Absorption Spectrophotometer.
The principle of atomic absorption spectroscopy (AAS) is the absorption of energy exclusively by ground state atoms while they are in the gaseous form.
A solution consisting of certain metallic species when aspirated into a flame, it will give rise to the corresponding vapours of metallic species. As it has already been discussed under flame emission spectroscopy (FES): Some metal atoms would be raised directly to an energy level to such an extent as to emit the particular radiation of the metal. At this critical point, a sufficiently large quantum of the metal atoms of a particular element would still remain in the non-emitting ground-state, which in turn shall be receptive of light radiation having their own specific wavelength. Consequently, when a light of this wavelength is passed through a flame ; along the atoms of the metallic species, a portion of the same would be absorbed; and the resulting absorption has been found to be directly proportional to the density of the atoms present in the flame at that material time. The concentration of the metallic element may be determined directly from the value of absorption.
253. Explain advantages of Atomic Absorption Spectrophotometer (AAS) over Flame Emission Spectroscopy (FES).
| Atomic Absorption Spectrophotometer (AAS) | Flame Emission Spectroscopy (FES) |
| This technique is superior and specific because of the fact that only the atoms of a particular element can absorb radiation of their own characteristic wavelength. | Spectral interferences usually take place in this technique. |
| A relatively large number of metal atoms produce an atomic absorption signal whereby the effect of flame-temperature variation is negligible in AAS i.e., independent of flame-temperature. | A much smaller number of metal atoms do produce an emission signal in FES, showing that this technique is not independent of flame, temperature. |
| The detection limits of sensitivity of the following elements are more by AAS technique, such as : Ag, As, Au, B, Bi, Cd, Co, and Fe. | The detection limits (sensitivity) of the undermentioned elements are higher by FES technique, for instance: Al, Ba, Ca, Eu, Ho, In, K and La. |
254. Disadvantages of Atomic Absorption Spectrophotometer (AAS).
The various points of demerit of atomic absorption spectroscopy are as follows :
(1) It essentially requires a separate lamp for each element to be determined ; and this serious lacuna is usually overcome either by using a line-source with the introduction of flame or by using a continuous source with the introduction of a very high resolution monochromator,
(2) AAS cannot be employed very effectively for such elements that produce their corresponding oxides when exposed in the flame, for example : Al, Mo, Si, Ti, W, V. Nevertheless, these estimations may be performed under suitably modified experimental parameters, and
(3) When the solutions of metal salts are made in an aqueous medium the predominant anion present affects the resulting signal to a negotiable extent.
255. What are the important aspects of atomic absorption spectroscopy?
The following three important aspects of atomic absorption spectroscopy:
(i) Analytical Techniques,
(ii) Detection Limit and Sensitivity, and
(iii) Interferences.
256. What are the Analytical Techniques used in Atomic Absorption Spectroscopy?
- Calibration curves
- Standard addition method
257. Which typical interferences are observed in Atomic Absorption Spectroscopy?
(i) Spectral Interferences,
(ii) Chemical Interferences,
(iii) Ionisation Interferences.
258. Applications of Atomic Absorption Spectroscopy.
i. Assay of total zinc in insulin zinc suspension
ii. Assay of palladium in carbenicillin sodium
ii. Cognate assays
Thin-Layer Chromatography (TLC)
259. Explain the theory of Thin-Layer Chromatography (TLC).
The adsorbent used for TLC is a thin, uniform layer (approximate thickness is 0.24 mm) of a dry, finely powdered material applied to an appropriate support, such as a glass plate or an aluminium sheet or a plastic foil.
Thereafter, the mobile phase is permitted to move across the surface of the plate (by capillary action) and the chromatographic phenomenon is depend upon adsorption, partition, or a combination of both, depending on the adsorbent, its treatment, and the nature of the solvents employed.
To carry out the analysis using the chromatographic separation procedure the TLC-plate is placed in a chromatographic chamber, generally made up of glass to enable clear observation of the movement of the mobile phase up the plate, that is pre-saturated with the solvent vapour.
260. Give some examples of Thin-Layer Chromatography (TLC) inert solid supports.
Examples of the inert solid supports are, alumina, silica gel, kieselguhr and cellulose.
261. Why Thin-Layer Chromatography (TLC) is considered more versatile then paper and column chromatography.
(i) Simple equipment: TLC requires simple equipment, such as micro-slides, jars with lid, glass-sprayers, strips of glass sheet, and small chromatank.
(ii) Short development time: The separation is very rapid. The development time is of short duration (around 1 hour) for reasonably good separation on inorganic adsorbent layers.
(iii) Wide choice of stationary phase: TLC may be used for adsorption, partition (including reversed phase) or ion-exchange chromatography,
(iv) Quick recovery of separated constituents: TLC permits the possibility of removal of the adsorbent coating on the plates by scraping with a spatula. In other words, a spot or a zone can be removed quantitatively, and the separated constituent dissolved in an appropriate solvent is estimated either by suitable spectrophotometric or colorimetric analysis.
(v) Separation effects: The separation effects obtained by TLC are more distinctive and superior than those of paper chromatography,
(vi) Easy visualization of separated components: Detection of fluorescence components when exposed to UV light is much easier than on paper by virtue of the fact that inorganic material (i.e., adsorbent) has intrinsic fluorescence,
(vii) Detection Limit: TLC affords extremely sharp delineated spots and offer lower detection limit i.e., one decimal power less than that in paper chromatography,
(viii) Variable thickness of layers: The method employed in TLC may be further extended to preparative separations by using thicker layers and also to meet separations by column chromatography,
(ix) Chemically inert stationary phase: Use of inorganic adsorbents e.g., alumina and silica, in TLC allows the application of corrosive sprays to detect fractionated substances, for instance: carbohydrates by 70% conc. H2SO4,
(x) Trace analysis: TLC method is suitable as micromethod in trace analysis.
262. Explain different techniques for preparation of thin layers on plates.
The most important aspect of preparation of thin layer is that it must be uniform and consistent throughout. Following are different techniques for preparation of thin layers on plates.
(a) Pouring of Layers
(b) Dipping
(c) Spraying
(d) Spreading
(e) TLC-Plates ready-for Use (or Pre-coated Plates)
(a) Pouring of Layers: In order to obtain layers of equal thickness, a measured amount of the suspension or slurry is placed on a given-size plate that is rested on an absolutely labelled surface. The plate is subsequently tipped backward and forward to permit the slurry (or suspension) to spread uniformly on the surface of the plate.
(b) Dipping: In this technique, two plates at a time back-to-back are dipped together in a slurry of the adsorbent in either chloroform or chloroform methanol.
(c) Spraying: In this method use of a small paint-sprayer is used for the distribution of the suspension or slurry onto the surface of the glass-plate.
There are two major disadvantages of using this technique, i.e. (i) Non-uniformity of layers on a single-plate, and (ii) Variation observed from one plate to the other was significant.
(d) Spreading: In this technique the suspension or slurry is put in an ‘applicator’, which is subsequently moved either over the stationary glass-plate or vice-versa i.e., it is held stationary while the glass plate is pulled or pushed through. This technique usually yields uniform thin layers on the glass plates.
263. What are the advantages of ‘ready-for-use’ TLC-plates?
• It can be safely activated at 110-120° C, before, use,
• The properties of the layer minimize spot-diffusion that helps both more strong concentration of spots and more distinctive separations with higher sensitivity,
• It generally accepts more corrosive spray-reagents, for example: conc. sulphuric acid, phosphoric acid, phosphomolybdic acid, perchloric acid on antimony trichloride. Also the sprayed plates could be heated upto 110-120 °C without any darkening,
• The migration rate is slightly enhanced when compared to hand coated plates, and
• The TLC plates may be cut into strips by the aid of a glass cutter applied on the reverse side.
264. What should be considered to choose adequate adsorbent for TLC?
The choice of adsorbent in TLC plays a key role in the separation of components either belonging to natural origin or to purely synthetic origin. Following attributes helps to choose the adsorbent for TLC:
(i) Solubility of the substance e.g., hydrophilic and lipophilic,
(ii) Nature of the compound i.e., whether it is acidic/basic/neutral/amphoteric
(iii) Reactivity of compound with either the solvent or the adsorbent, and
(iv) Chemical reactivity of compounds with the binders.
The adsorbents are of mainly two types, inorganic, and organic adsorbents.
265. What are the inorganic, and organic adsorbents used for TLC?
A. Inorganic adsorbents
(i) Aluminium oxide
(ii) Aluminium Silicate
(iii) Bauxite (aluminium oxide ore)
(iv) Bentonites
(v) Calcium Carbonate
(vi) Calcium Hydroxide
(vii) Calcium Oxalate
(viii) Calcium Silicate
(ix) Calcium Sulphate
(x) Dicalcium Phosphate
(xi) Fuller’s Earth
(xii) Hydoxyl-Apatite
(xiii) Kieselguhr (Diatomaceous Earth)
(xiv) Magnesium Silicate (Magnesol)
(xv) Silica Gel (of pH 6.0)
(xvi) Tri-calcium Phosphate
(xvii) Water-soluble salts
(xviii) Zinc Carbonate
B. Organic Adsorbents
(i) Cellulose and Acetylated Cellulose
(ii) Charcoal and Activated Carbon
(iii) Dextran Gels
(iv) Cellulose Ion-Exchange Powder
(v) Ion-Exchange Resins
(vi) Polyamide
(viii) Sucrose
266. What should be considered to choose a solvent system for TLC?
The choice of solvent or a mixture of solvents used in TLC is depend on two important attributes:
(a) the nature of the constituent to be separated (polar or non-polar)
(b) the nature of the process involved (‘adsorption’ or ‘partition chromatography’)
267. What is meant by activation of adsorbent for TLC?
Activation of the TLC plate means completely eliminating the solvent embedded into the thin layer of coated adsorbent.
It is achieved conveniently first by air-drying the TLC plates for a duration of 30 minutes and then in a hot-air oven maintained at 110 °C for another 30 minutes and subsequently cooling them in a dessicator.
This drying process helps a great extent in rendering the adsorbent layer active. In order to achieve very active layers, silica gel and alumina coated plates may be heated upto 150 °C for a duration of 4 hours and cooling them in a dessicator.
268. Explain the process of purification of silica gel-g layers for TLC?
The iron present as an impurity in silica gel-G affords an appreciable distortion of the ‘chromatogram’. Therefore, it is necessary step to purify the adsorbent.
The ‘iron-free’ layers may be achieved by providing the pre-coated and air-dried plates a preliminary development with a mixture of methanol and concentrated hydrochloric acid (9 : 1).
By this process the entire iron gets migrated with the solvent front to the upper boundary of the TLC plate. Therefore, the purified plates are again dried and activated at 110°C.
The cleaning process usually washes out the CaSO4 originally present as binder. Hence, the silica gel thus obtained by purification may be reused to prepare TLC-plates with other appropriate binders like gypsum, starch etc.
269. What is Equilibration of the Chamber in TLC and why it is important?
The equilibration of the chamber or chamber-saturation is a vital factor to obtain reproducible Rf values.
Equilibration of the chamber is achieved by allowing the solvent system to remain in the chamber for at least 1 to 2 hours so that the vapours of the solvent(s) would pre-saturate the latter adequately.
This is done to obtain distinct separation of constituents, uniform solvent from and prevent evaporation of the solvent on TLC-plates.
270. How to protect TLC experiment from Oxidation?
Both temperature and light augments oxidation and, hence, the following experimental Conditions can b maintain to obtain the best development of thin-layers,
Temperature: 18-23°C, and Light : Diffused daylight both natural and artificial,
Note: Direct sunlight (UV) or drought may give rise to ‘oblique formation’ of the solvent front.
271. What is the meaning of visualization in the TLC experiment?
As a result of both intensive as well as extensive research a number of organic and inorganic substances have been identified that positively demonstrate an ‘improved visualization’. Such substances are termed collectively as ‘fluorescent indicators’.
272. Examples of fluorescent indicators in the TLC experiment to aid visualization?
Following are examples of fluorescent indicators in the TLC experiment to aid visualization
- Barium diphenylamine sulphonate
- 2,7-dichlorofluorescein
- Fluorescein (0.2% w/v in Ethanol)
- Morin (0.1% w/v in Ethanol)
- Sodium fluorescinate (0.4% w/v in water)
- Rhodamine B
- Zinc Silicate
- Calcium silicate
- Methylumbelliferone (or 7-hydroxy-4-methyl coumarin)
273. Explain various special techniques of TLC.
(a) Horizontal TLC
(2) Continuous TLC
(3) Preparative TLC
(4) Multiple Dimensional TLC
(5) Two-Dimensional Chromatography
(6) Centrifugal Chromatography
(7) Wedged-Tip Chromatography
274. Explain Horizontal TLC technique.
In this technique, the horizontal development of loose-layer TLC plates were made by using a shallow dish having a ground glass cover. The TLC plate was carefully rested on a T-shaped glass piece and the starting end was pressed duly against a filter paper held by another glass strip, which allowed the solvent to move to the thin-layer-film from the bottom of the dish by capillary action.
275. Explain Continuous TLC technique.
Continuous TLC technique is good for the separation of such components having small as well as very close Rf values. Following are the technique:
(a) Rectangular horizontal plates where the solvent is allowed to move over them and subsequently evaporated after it has almost reached the end of the run, and
(b) Triangular glass-plates-where the mixture to be separated is spotted near the apex on a thinlayer and two different solvent mixtures are fed from two sides to the thin-layer and fractions
subsequently collected at the base.
276. Explain Preparative TLC technique.
TLC may be skillfully extended to cater for extremely useful method for preparative separations. To maintain uniformity, as a rule, plates of 20 cm height and 20-100 cm length with layers between 0.5 and 0.2 mm thickness are normally employed. It essentially has three cardinal features, namely:
(a) Component mixtures is always obtained either in streaks or bands,
(b) Separation is invariably accomplished by multiple development, and
(c) Localization of separated components is only done under UV-light.
277. Explain Multiple Dimensional TLC technique.
Multiple Dimensional TLC technique can be regarded as a variant of multiple development chromatography.
278. Explain Two-Dimensional Chromatography TLC technique.
It is also termed as two-dimensional planar chromatography. Here, the sample is spotted in one corner of a square TLC plate (size : 20 cm × 20 cm). The development is first carried out in the ascending direction using solvent-1. The solvent is then eliminated by evaporation and the plate is rotated through 90°, following which ascending with the second solvent is accomplished.
After Removal of the solvent the spots of separated constituents are located by spraying with specific reagents.
279. Explain Centrifugal Chromatography TLC technique.
It essentially makes use of the ‘centrifugal force’ so as to accelerate the flow of solvent through the thin-layer of the chromatogram. The sample mixture is applied 2.5 cm from the centre hole and the solvent system is set to allow a constant flow, with the centrifuge rotating at 500-700 RPM. In this manner, the usual developing time of 35 minutes is drastically reduced to mere 10 minutes by acceleration.
280. Explain Wedged-Tip Chromatography technique of TLC.
This technique exhibit the following two plus points, namely :
(a) Improved separation, and
(b) Constituents forced to assume an almost band-like path.
For TLC-plate with wedged-tip, following steps are to be adopted sequentially:
(i) Draw dividing lines 0.5 to 1.0 mm broad on the surface of the layer with a narrow-metal spatula,
(ii) Pentagons are facilitated by the help of a stencil made of transparent plastic material, and
(iii) Sample mixture are applied to the narrow portion of the wedge to get the best results.
281. Explain the process of detection of components in TLC.
After development of TLC plates, the next important step is to detect the separated components so as to determine their respective Rf values. It can be achieved using following techniques:
(i) Coloured Substances: e.g., Xanthophylls, Chlorophylls, Carotenes, etc., may be located visually.
(ii) Colourless Substances: e.g., alkaloids, steroids, amino acids and the like may be detected under short-wave UV-light or a long-wave UV-light. These substances may also be detected as brown/dark brown spots when exposed to I2-vapours in a closed dessicator.
(iii) Specific Detecting Reagents: A few specific detecting reagents are normally used for a particular class of compounds e.g., Aniline-phthalate reagent : for carbohydrates; Ninhydrin reagent: for amino-acids, and Dragendorff’s reagent: for alkaloids
(iv) Chromic acid/conc. H2SO4: These corrosive reagents usually char the organic material on TLC plates and may be seen as dark brown spots.
282. Explain the process of evaluation of the chromatogram in TLC.
After completing the detection procedure the various separated solutes on the TLC plate are marked with the help of a sharp needle (e.g., pithing needle); subsequently, their evaluation could be carried out either qualitatively or quantitatively.
A. Qualitative Evaluation:
The Rf value (Retention Factor) various separated solutes is determined accurately. The Rf value represents the differences in rate of movement of the components duly caused by their various partition coefficients i.e., their different solubility in the mobile and stationary phases. In order words, the Rf value (relate to front) is-‘the ratio between the distance starting point-centre of spot and distance starting point-solvent front’, thus it may be expressed as :
Rf = Distance of centre of spot from starting point/ Distance of solvent front from starting point.
Characteristics of Rf value:
(i) Due to the always longer path of the solvent front, the Rf value is invariably lesser than 1.
(ii) Rf value is always constant for each component only under identical experimental parameters,
(iii) Rf value depends upon a number of governing factors, such as: quality of the layer material; activation grade of the layer ; thickness of layer; quality of solvent; equilibration of chamber; chromatographic technique employed (e.g., ascending, descending); presence of impurities; and conc. of simple applied; and
(iv) All possible anomalies in (iii) above may be eliminated by performing a co-chromatogram of a standard substance along with that of a sample. Thus, the distance traversed by a substance is compared with that of the standard (or reference). This ‘new’ relation is usually designated as Rst value.
Therefore, in short, it is expressed as follows :
Rst = Rf of the substance/ Rf of the standard
Unlike the Rf value, the Rst value may be more than 1.00 because here the substance under investigation (i.e., sample) usually travels further than the standard. In TLC, the qualitative evaluation is solely based on the determination of Rf values of unknown spots vis-a-vis Rf values of standard substances preferably on the same TLC plate so as to avoid any possible error whatsoever.
B. Quantitative Analysis:
The quantitative analysis of chromatographically separated constituents may be carried out with high degree of accuracy and precision in two manners, namely :
(i) Direct Method : i.e., the quantitative determinations is performed directly on the adsorbent layer, and
(ii) Indirect Method : i.e., the separated constituents are quantitatively removed from, the adsorbent and subsequently estimated after elution.
(a) Direct Methods:
The various methods under this category are, namely :
(i) Measurement of Spot-areas : This method is solely based on a mathematical relationship existing between the prevailing spot area and the amount of component present. It is not quite accurate due to high random errors.
(ii) Densitometry : The intensity of the colour of a component is measured on the chromatogram using a densitometer.
(iii) Spectrophotometry : Characterization of the separated spots by reading the absorption or fluorescence curves directly from TLC plates is carried out with the help of Chromatogram Spectrophotometer devised by Zeiss, Stahl and Jork.
Besides, IR-spectroscopy, reflectance spectroscopy, spark chamber method etc., may also be employed for the direct evaluation of chromatograms.
(b) Indirect Methods:
These methods are based on elution techniques, followed by micro-analysis of the resultant eluate by adopting one or more of the undermentioned known methods, namely: Colorimetry; Fluorimetry ; Radiometry; Flame-photometry; UV-Spectrophotometry; Gravimetry; Polarography; Vapourphase Chromatography ;
283. Explain the applications of TLC in pharmaceutical analysis.
The technique of thin-layer chromatography (TLC) has been used extensively in the domain of pharmaceutical analysis for a variety of specific and useful applications, for example :
(i) To identify the presence of undesirable specific organic compounds present as impurities in a number of pharmaceutical substances, namely : morphine in apomorphine hydrochloride ; hydrazine in carbidopa ; 3-aminopropanol in dexampanthenol ; etc.,
(ii) Related substances present in official drugs, namely : related substances present in a wide number of potent pharmaceutical substances e.g., aminophylline ; baclofen ; chloramphenicol ; carbamazepine etc.,
(iii) Foreign alkaloids present in alkaloidal drugs, for instance : atropine sulphate ; codeine;
(iv) Foreign steroids present in steroidal drugs, for example : betamethasone valerate;
(v) Ninhydrin positive substances in official amino acids e.g., glutamic acid; leucine;
HPLC Interview Questions and troubleshooting
Click Here to refer Most useful 80+ HPLC Interview Questions and troubleshooting
Refer Complete guide on High Performance Liquid Chromatography (HPLC)
For more interview questions and answers Click Here
Reference – Pharmaceutical Drug Analysis by A-s-h-u-t-o-s-h K-a-r, Wikipedia and other relevant textbooks