

SOP for Usage of Minitab Functions in Pharmaceuticals
1. Purpose:
The purpose of this SOP is to define procedure for operation and usage of Minitab software to prepare trend charts, and perform statistical analysis of data.
This SOP Covers Procedure for:
- Trending of Data
- Determination of Control Limits
- Calculation of Process Capability (Cpk and Pkp) (To read more about Process Capability Indices (Cp, Cpk, Pp, Ppk) and to Download Free Excel Sheet Click Here)
- Six pack analysis of Data
2. Scope:
This standard operating procedure is applicable for preparation of trend charts, and perform statistical analysis of data using Minitab software at [company name].
3. Responsibility:
Trained personnel from each department: To prepare trend chart and perform statistical analysis of data.
Department – Head: To tend chart and data analysis generated from the Minitab Software.
4. Definitions:
SOP – Standard Operating Procedure
UCL – Upper Control Limit
LCL – Lower Control Limit
5. Procedure:
• The Minitab software shall use for data analysis with graphs and conducts statistical analysis, assess quality and design an experiment.
• The Minitab software is used to evaluate the process using the statistical tool test whether process is operating within specification limit and to determine ways to improve processes.
• Minitab user interface:
– Minitab shall be operated from the windows taskbar by choosing Start → All Programs → Minitab → Minitab18.
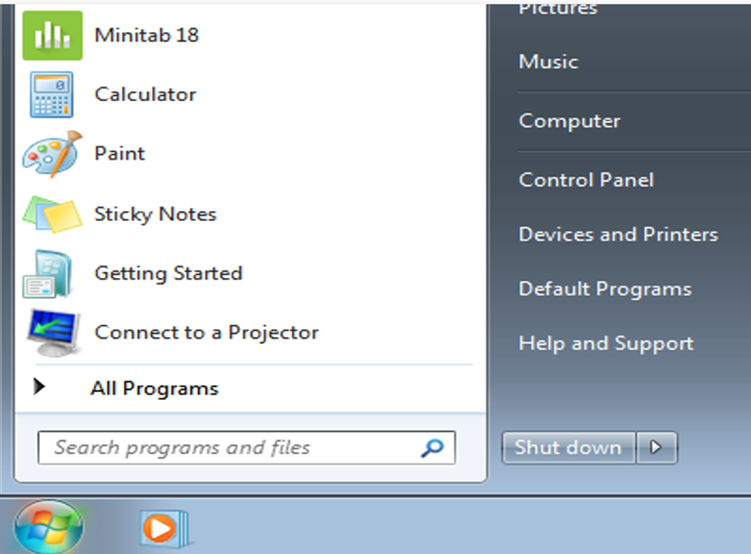
– After selecting Minitab 18, following screen shall appear:

– By default, Minitab opens with two windows visible and one window minimized.
– Session window
– The Session window displays the results of your analyses in text format. Also, in this window, you can enter session commands instead of using Minitab’s menus.
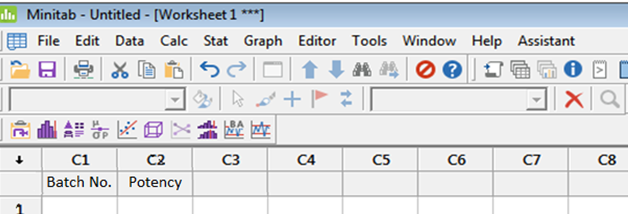
– Worksheet: The worksheet, which is similar to a spreadsheet, is where you enter and arrange your data. You can open multiple worksheets.
– Project Manager – The third window, the Project Manager, is minimized below the worksheet.

• Projects and Worksheet:
– In a Project manager, you can manipulate data, perform analyses, and generate graphs. Projects contain one or more worksheets.
– Project (.MPJ) files store the following items:
i. Worksheets
ii. Graphs
iii. Session window output
iv. Session command history
v. Dialog box settings
vi. Window layout
vii. Options
– Worksheet (.MTW) files store the following items:
i. Columns of data
ii. Constants
iii. Matrices
iv. Design objects
v. Column descriptions
vi. Worksheet description
– Save the perform work as a project file to keep all of your data, graphs, dialog box settings, and options together.
– Save the perform work as a worksheet file to save only the data. A worksheet file can be used in multiple projects. Worksheets can have up to 4,000 columns. The number of worksheets can be stored in a project.
• Data types:
– A worksheet can contain the following types of data.
i. Numeric data: Numbers, such as 264 or 5.28125.
ii. Text data: Letters, numbers, spaces, and special characters, such as Test #4 or North America.
iii. Date / time data: Dates, such as Mar-17-2023, 17-Mar-2023, 3/17/23, or 17/03/23.
iv. Times, such as 08:25:22 AM.
v. Date/time, such as 3/17/23 08:25:22 AM or 17/03/23 08:25:22.
• Open and examine a worksheet:
– Start the Minitab software as mention above.
– The collected raw data of manufacturing / quality process shall transfer to worksheet of Minitab software by following:
i. Type the data directly into the worksheet.
ii. Copy and paste the data from other applications.
iii. Import the data from Microsoft Excel files or text files.
– The data are stored in the worksheet as .MTW file.

• After data are in Minitab worksheet need to edit cells or reorganize columns and rows prepare the data for analysis. Some common manipulations are stacking, sub setting, specifying column names, and editing data values.
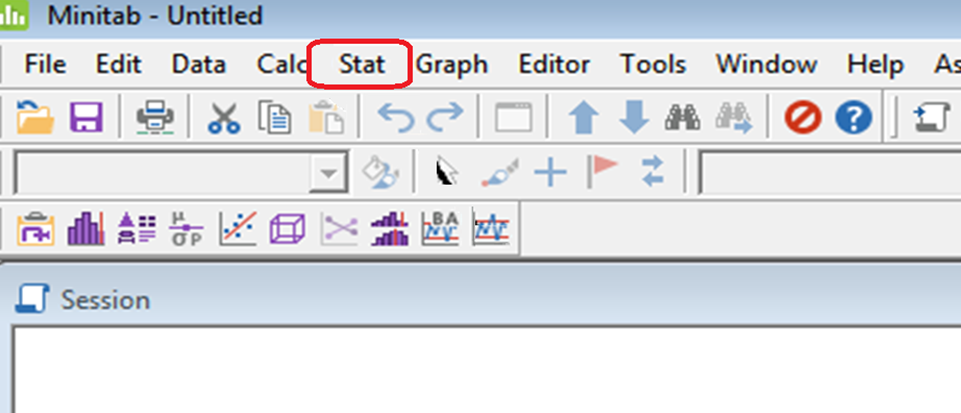
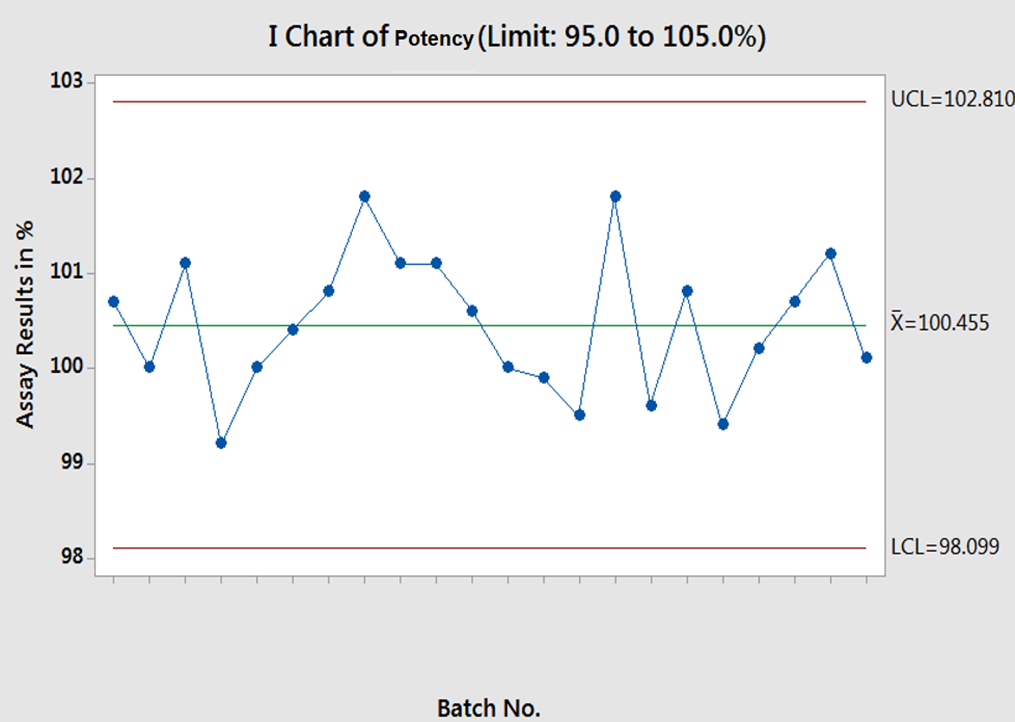
• Graphing Data: – For Trending of data with Control Charts (UCL & LCL): Select Stat from menu bar.
– Then select Control Charts → Variable charts for individuals → Individuals.
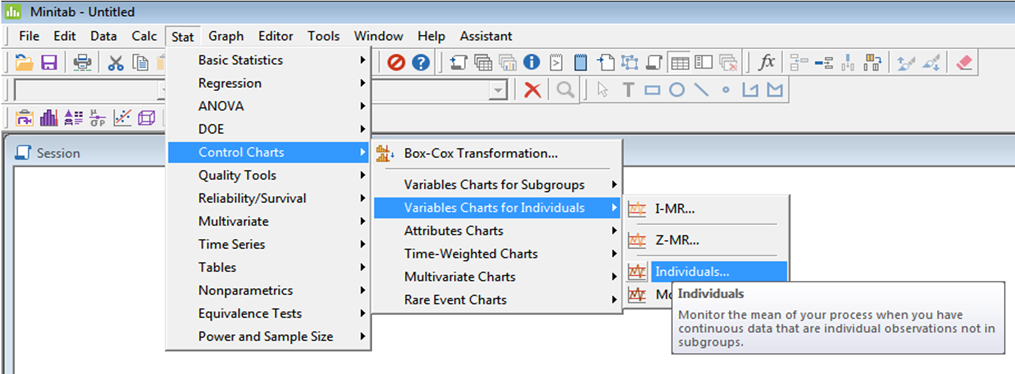
– Following screen shall appear.
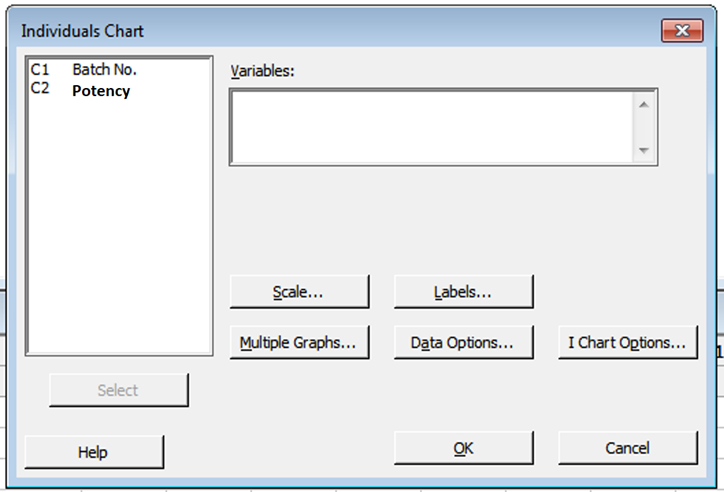
– Write Potency or double click Assay by keeping courser button below the box of where variable terminology written.

– After entering variables data which represents as Y axis, next step shall be entering the data of X axis which are the Batch Number.
– Batch Number shall be entered by selecting Scale button.

– Then select Stamp.
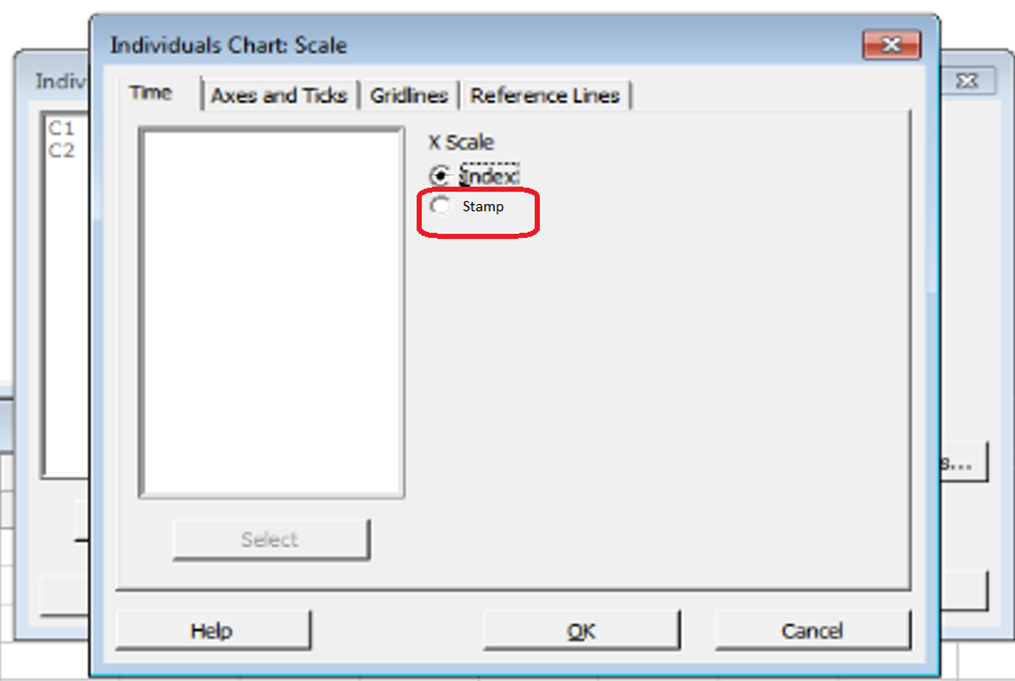
– After Selecting Stamp, following screen shall be appearing.
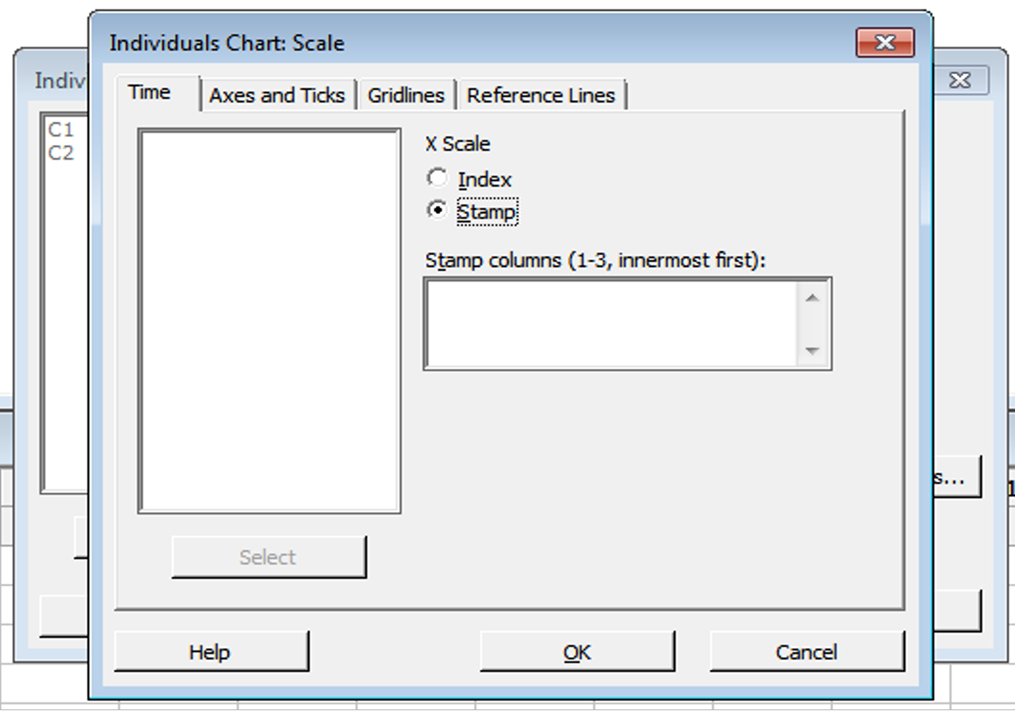
– Keep courser in Stamp column box. Write Batch No. or double click Batch No. by keeping courser below the box of where Stamp column terminology written.
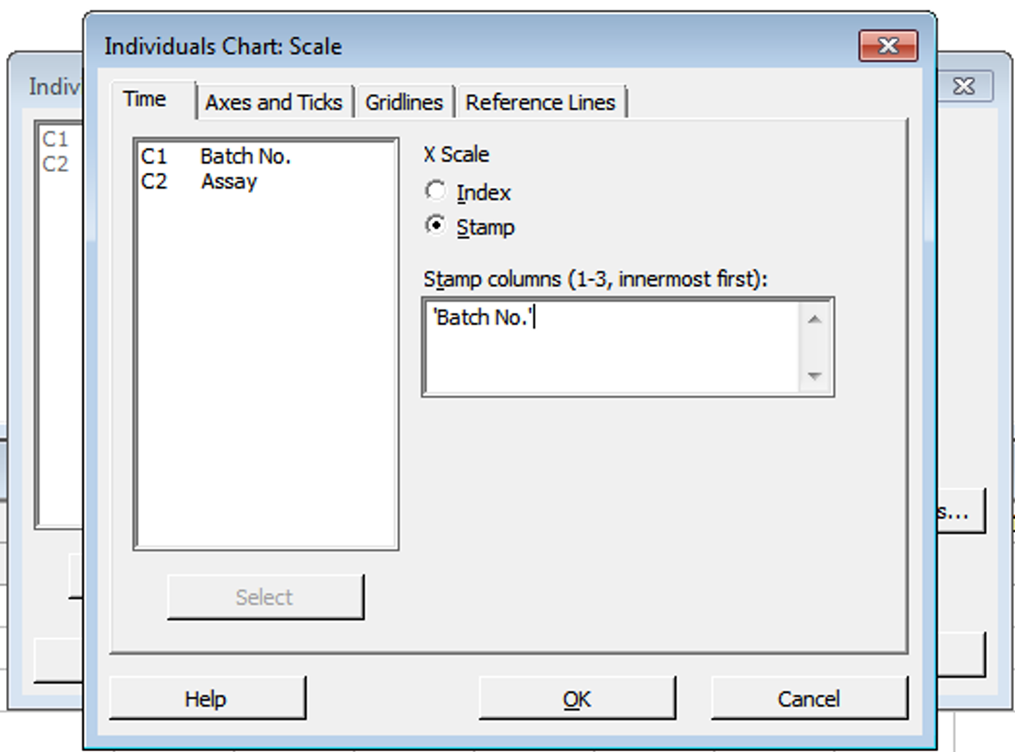
– After entering X axis and Y axis, beside the scale button Labels button available for addition of Title of graphs. Then press on OK button.

– Following graph shall be appearing with UCL & LCL value.

– Make necessary changes as per availability of data like, Upper and lower limit, Total no. of batch visible, any title modification but not limited to.
– Trending and UCL & LCL value are not changes with the above type modifications.
– The Graph shall be transfer to Word or PowerPoint and used in documents where it needs.
– For trending of Data with Quality Tools: Select Stat from menu bar.

– Then select Quality Tools → Capability Six pack → Normal.
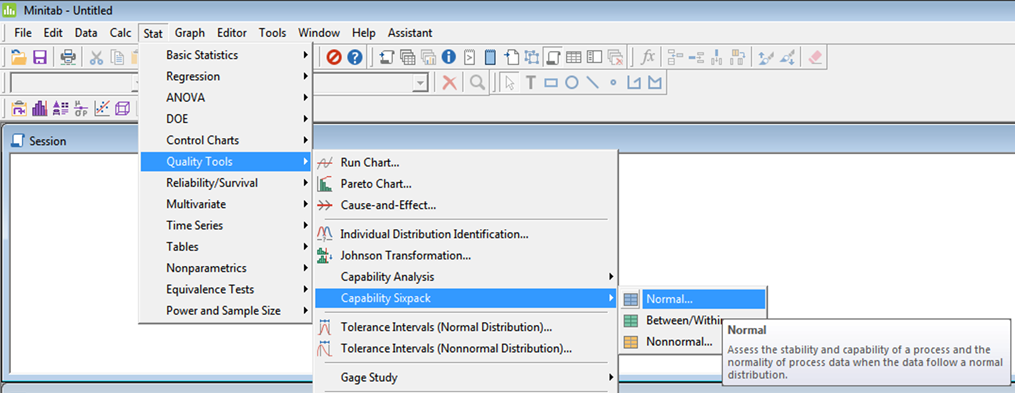
– Following screen shall appear.

– Write Assay or double click Assay by keeping courser beside the box of where Single column terminology written.
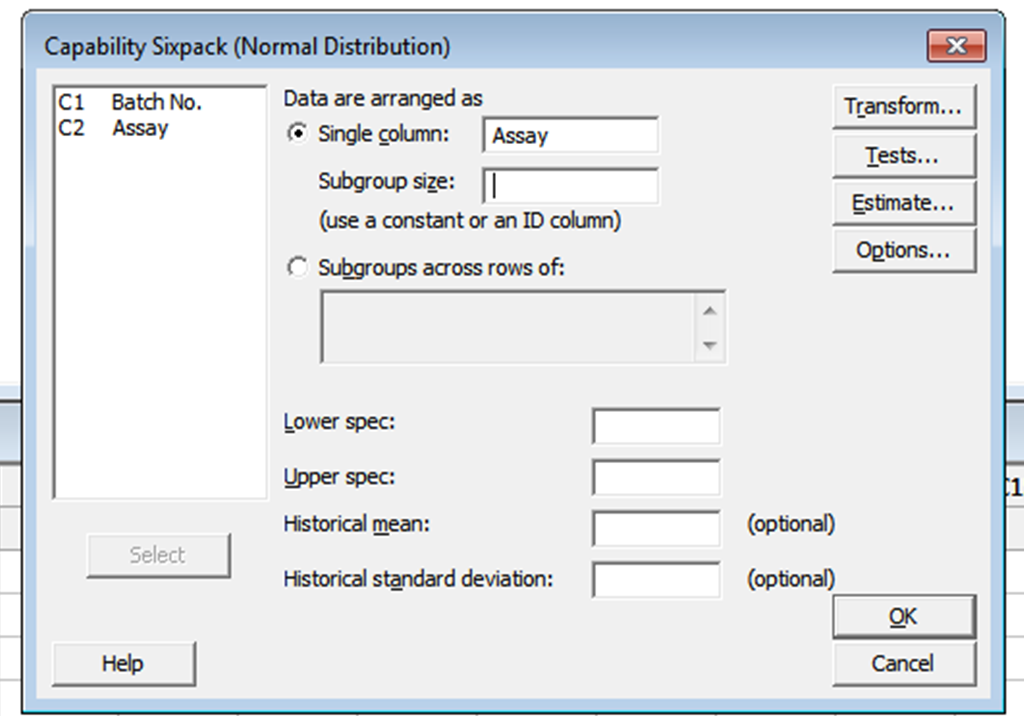
– After entering Single column data which represents as Y axis, next step shall be entering the data of X axis which are the Batch Number.
– Batch Number shall be entered by writing Batch No. or double click on Batch No. by keeping courser beside the box of where Subgroups terminology written.
– Write Lower limit and Upper limit as per applicability of test.
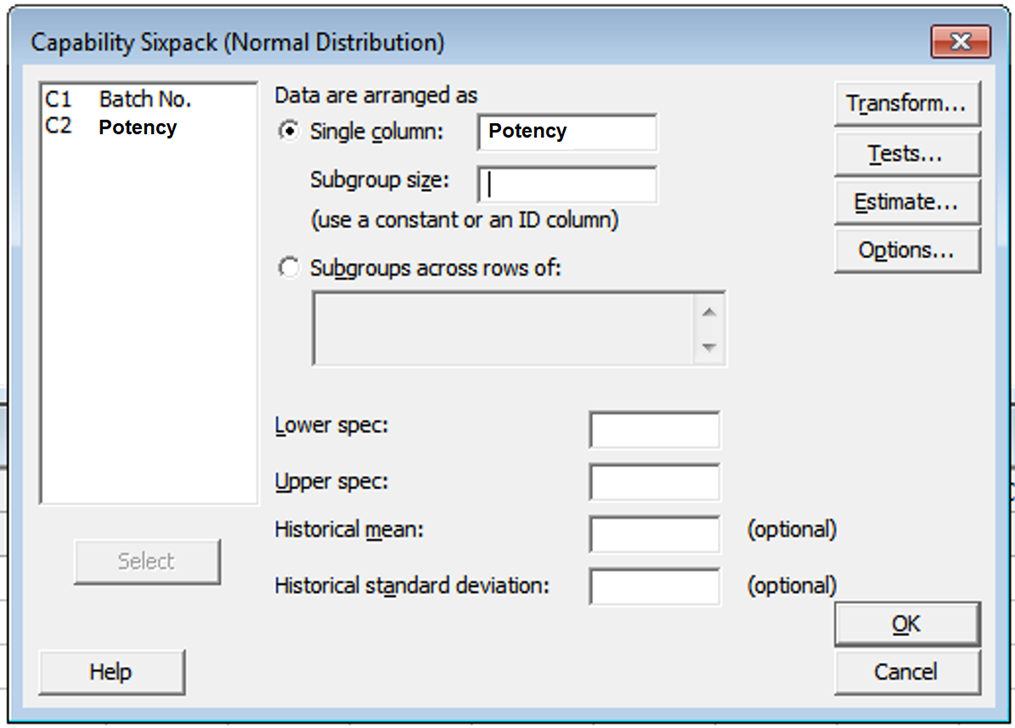
– Transform, Tests, Estimate and Options shall be selected as per applicability.

– Then press on OK button. Following different graph shall be appearing representing with quality tools.

– Make necessary changes as per availability of data like, Upper and lower limit, Total no. of batch visible, any title modification but not limited to.
– Trending and Quality tools are not changes with the above type modification.

– The Graph shall be transfer to Word or PowerPoint and used in documents where it needs.
6. Frequency:
During release of every batch – To enter data of Critical Process Parameters (CPP) and Critical Quality Attributes (CQA) in Minitab
Yearly – Use of Minitab for Annual Product Quality Review (APQR) Preparations
As and when required – During the investigation for data analysis
7. Format for recording:
Not Applicable